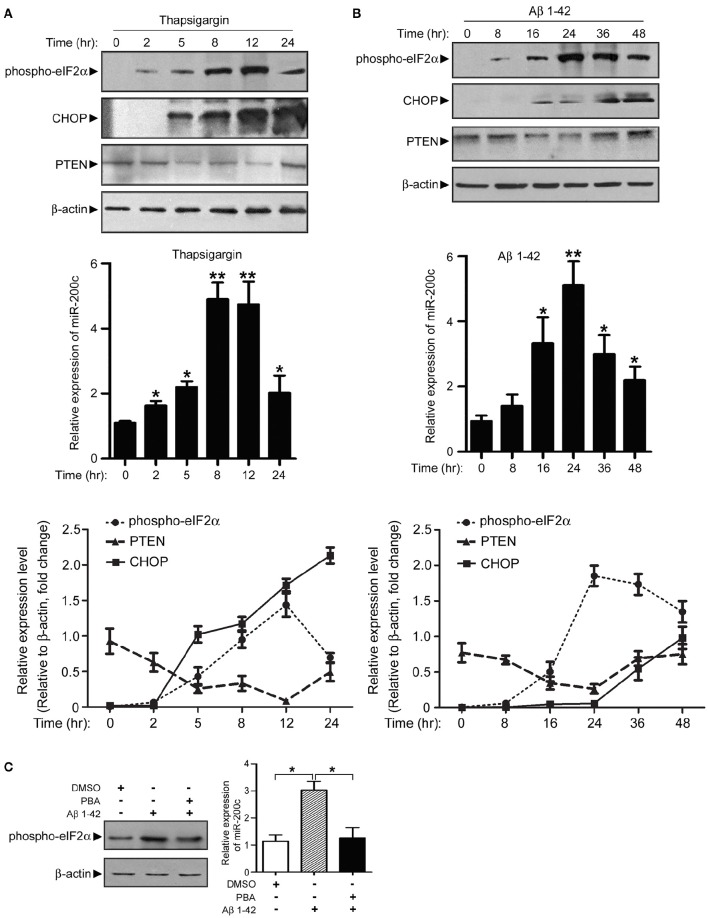
Figure 6.
Expression of miR-200c is regulated by Aβ-induced ER stress. (A) PC12 cells were treated with thapsigargin and cell lysate was harvested at different time points as indicated. Phospho-elF2α, CHOP, and PTEN were detected by immunoblotting (left panel). Total RNA was also extracted and subjected to qPCR analysis of miR-200c (right panel). Expression level of miR-200c is represented as the fold change compared to time point 0. (B) PC12 cells were treated with Aβ, followed by similar experiments described in (A). Data are represented as mean ± SEM. (*P < 0.05, **P < 0.01, compared to time point 0). (C) NGF-differentiated PC12 cells were pretreated by ER stress inhibitor PBA for 2 h before 24 h Aβ treatment Phospho-eIF2α (left panel) or miR-200c (right panel) were detected by immunoblotting and qPCR, respectively. Data are represented as mean ± SEM. (*P < 0.01).

