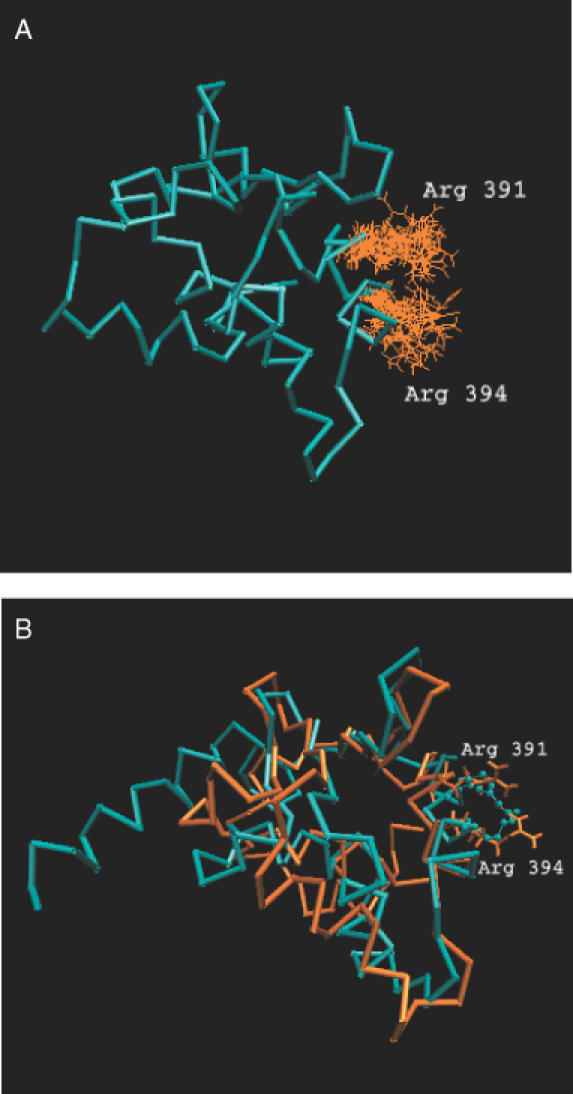
Figure 3.

(A) Orientation of the Arg side chains in the NMR models of murine ETS-1 (1etd). The NMR model-1 is represented as the cyan Cα trace. The orientation of the Arg residue from all the models is shown as orange lines. (B) Comparison of the side chain orientation of Arg in the DNA bound GA-binding protein (1awc) with the minimized average NMR structure (1etc) of murine ETS-1 The DNA bound protein (1awc) is shown as cyan Cα trace and the minimized average structure (1etc) in orange. Arg residues are shown as lines in 1etc and as CPK in 1awc.
