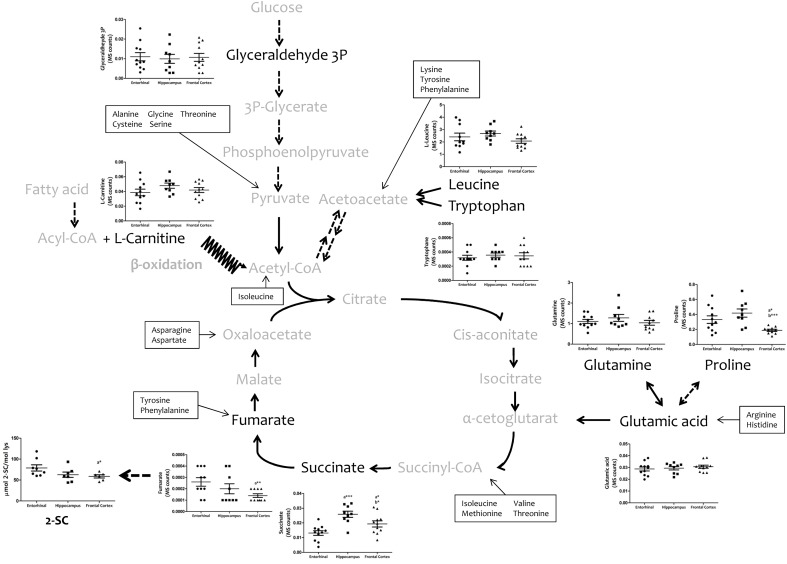
FIGURE 2.
Concentrations of metabolites involved in bioenergetics metabolism in different regions of the adult human cerebral cortex. Metabolites were detected and quantified with TQMS. The steady-state level of 2-SC was measured with GC-MS. ∗p < 0.05; ∗∗p < 0.01; ∗∗∗p < 0.001. a, significant differences with respect to entorhinal cortex; b, significant differences with respect to hippocampus.

