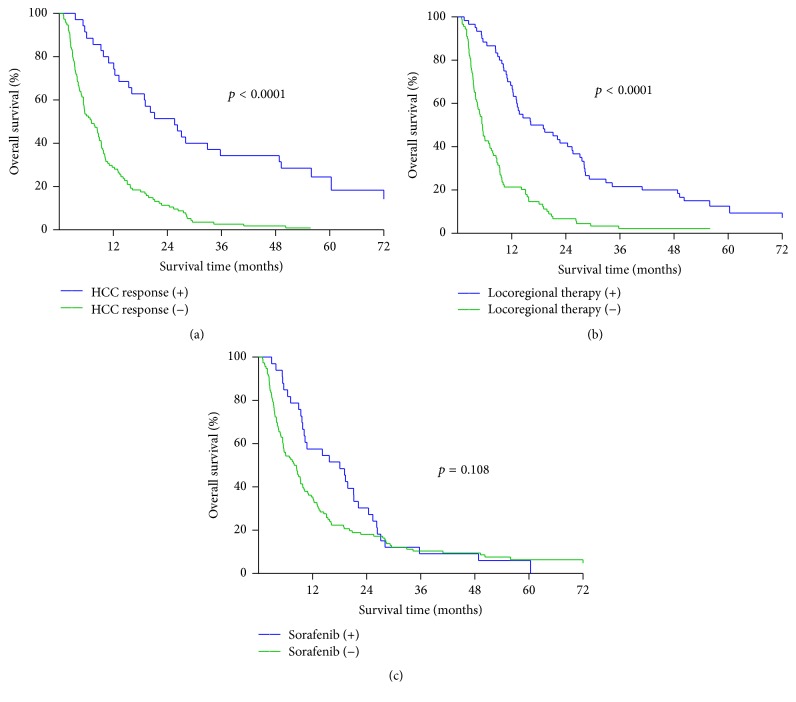
Figure 2.
Comparison of survival rates regarding therapeutic responses and additional treatments. (a) Comparison of the overall therapeutic response of HCC; patients with a therapeutic response (CR, PR; n = 35) had a significant better survival curve than patients without a therapeutic response (SD, PD; n = 114) (p < 0.0001). CR: complete response, PR: partial response, SD: stable disease, and PD: progression disease. (b) Patients who had received additional locoregional therapy (n = 60) experienced significantly better survival as compared with patients who were unable to receive locoregional therapy (n = 89) (p < 0.0001). (c) No statistical difference in survival rates in terms of sorafenib treatment (n = 33) and no sorafenib treatment (n = 116) (p = 0.108).

