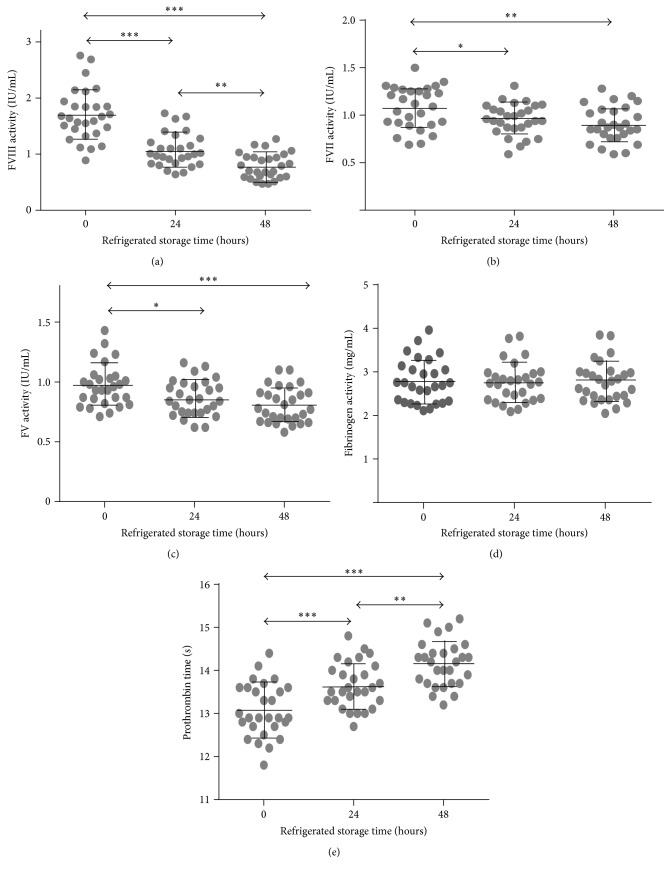
Figure 1.
Coagulation parameters in ACD-FFPA. ACD-FFPA units were tested for the activities or times shown on the y-axes after thawing (0 hours) and after 24 or 120 hours of refrigerated storage. Grey points represent individual values, while horizontal lines depict the mean and error bars one SD above or below the mean. Lines with arrowheads identify statistical differences among groups by two-way ANOVA with Tukey's post hoc tests: ∗ p < 0.05; ∗∗ p < 0.01; and ∗∗∗ p < 0.001.

