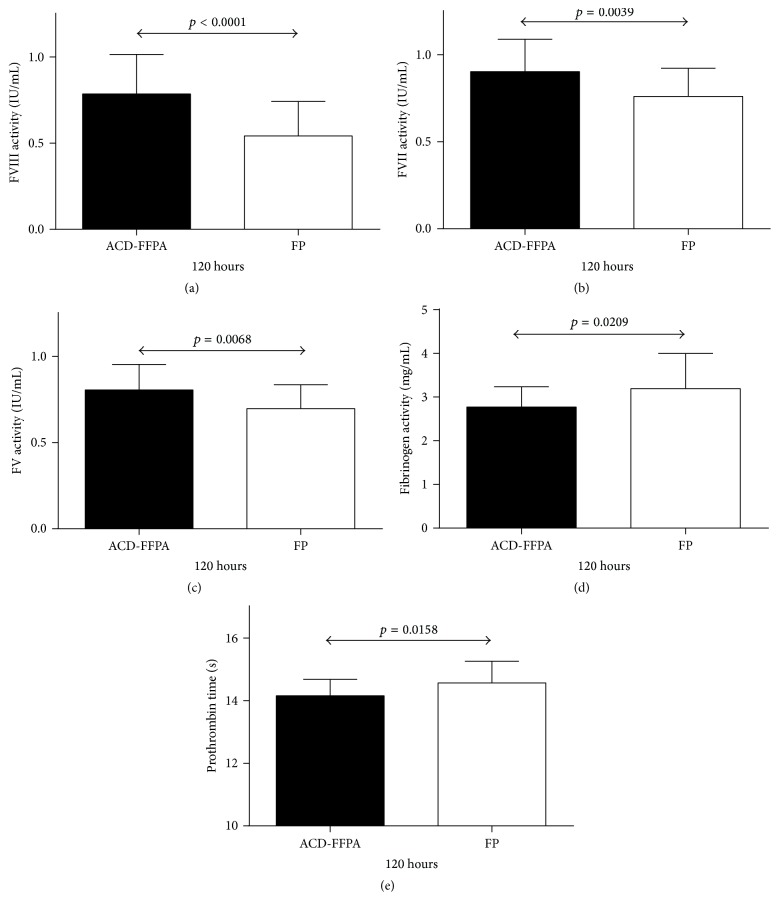
Figure 2.
Comparison of coagulation parameters in ACD-FFPA and FP. ACD-FFPA units (solid bars) or FP units (open bars) were tested for the activities or times shown on the y-axes after 120 hours of refrigerated storage. Lines with arrowheads identify statistical differences between the two groups, with p values above the lines. Data sets (b–e) passing tests of normality and of similarity of standard deviation were tested using the unpaired t-test, while Welch's t-test was applied to the data in (a).

