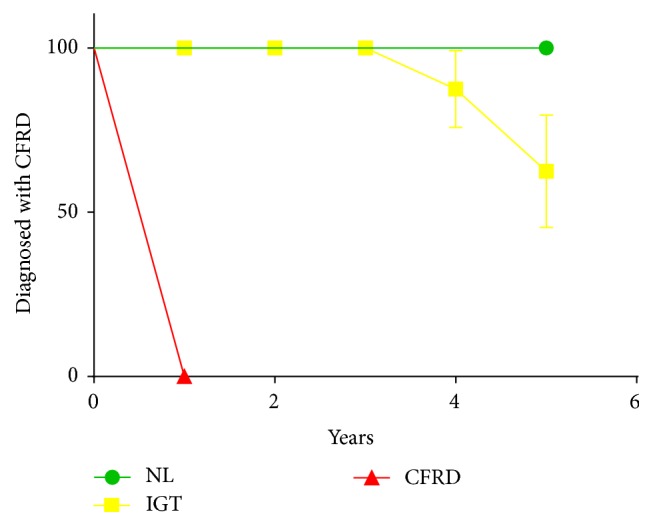
Figure 3.

Abnormal CGM results predict the development of guideline criteria diagnosed glucose abnormalities over time. CGM results were categorized as normal (green circles), impaired (yellow squares), or consistent with CFRD (red triangles). Time to event was analyzed using the Log-rank (Mantel-Cox) test. 0/1 subjects with normal CGM, 3/11 subjects with impaired glucose metabolism, and 5/5 subjects with CFRD by CGM were subsequently diagnosed with CFRD. (χ 2 = 17.27, DF = 2, p = 0.0002.)
