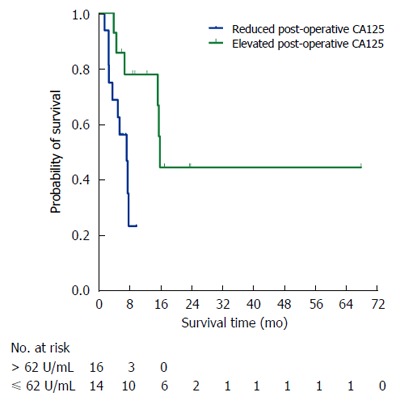
Figure 3.

Kaplan-Meier survival curves according to post-operative CA125 levels of PDAC patients with synchronous liver metastasis who underwent simultaneous resections for primary PDAC and synchronous liver metastasis (group A).

Kaplan-Meier survival curves according to post-operative CA125 levels of PDAC patients with synchronous liver metastasis who underwent simultaneous resections for primary PDAC and synchronous liver metastasis (group A).