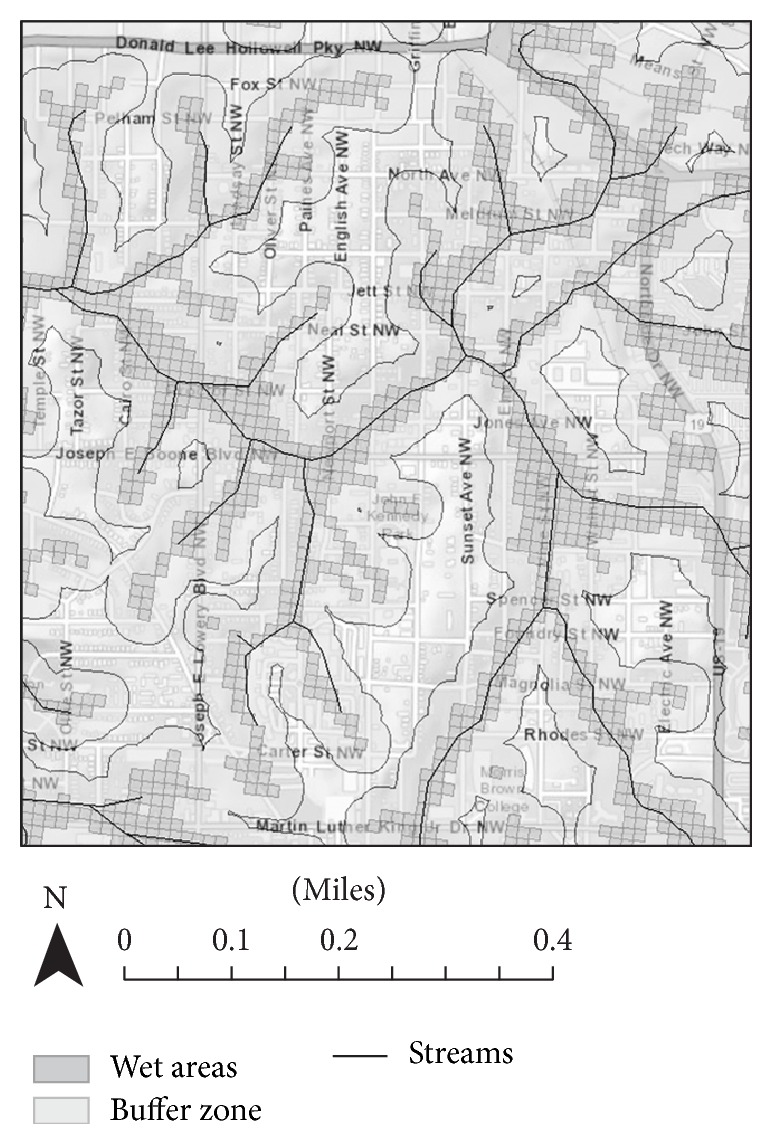
Figure 1.

Map of Study Boundaries and Wetness Index [street map is from ArcGIS World Street Map (sources: Esri, HERE, DeLorme, USGS, Intermap, iPC, NRCAN, Esri Japan, METI, Esri China (Hong Kong), Esri (Thailand), MapmyIndia, TomTom©, OpenStreetMap contributors, and the GIS User Community)]. Wetness Index map and stream map were obtained from US EPA.
