
Figure 1.
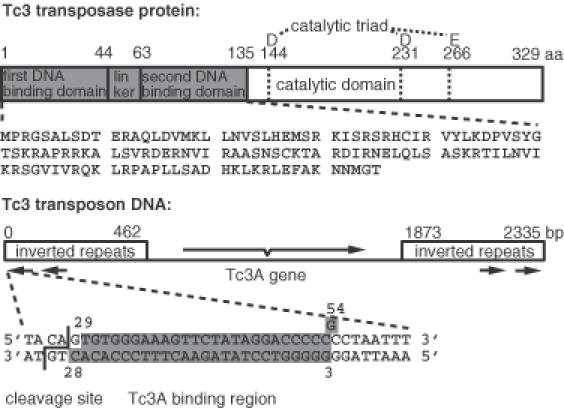
Schematic representation of Tc3 transposase protein (Tc3A) and Tc3 transposon DNA. Gray boxes indicate which part of the protein and DNA were co-crystallized in this study. The DNA numbering is indicated. G54 was used instead of the naturally occurring C to create an overhang that can form a base-pair with C28. The arrows under the inverted repeats of the DNA indicate the two almost identical binding sites of Tc3A separated by ∼180 bp at each transposon end (9).