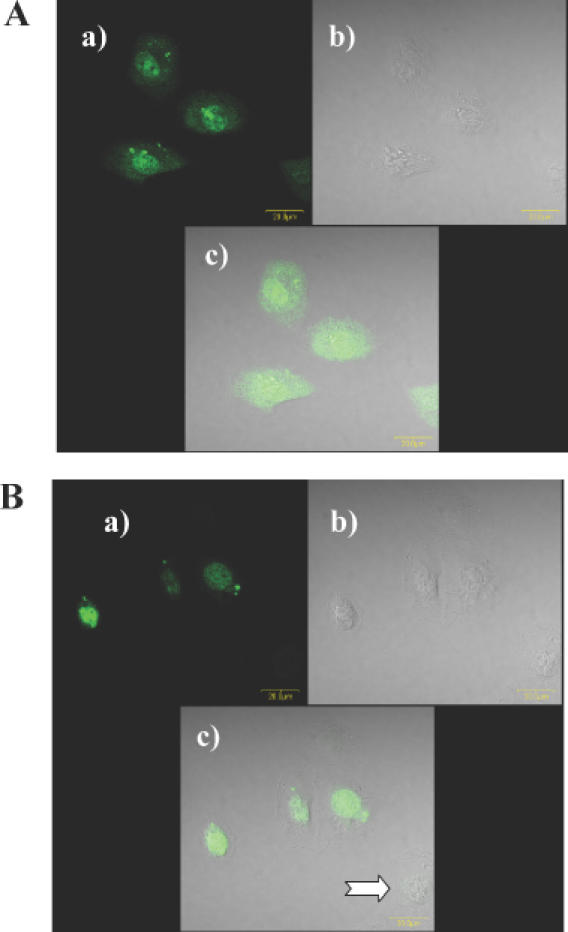
Figure 2.

Cellular uptake and distribution of HNA derivatives. NIH 3T3 MDR cells were treated with fluorescein-labeled HNA derivatives (10 nM) complexed with Lipofectamine 2000. (A) HNA (GS1954); (B) HNA gapmer (GS1956). (a) fluor-labeled oligonucleotide; (b) phase contrast image; (c) overlay image. Note that some of the cells lack fluorophore (arrow).
