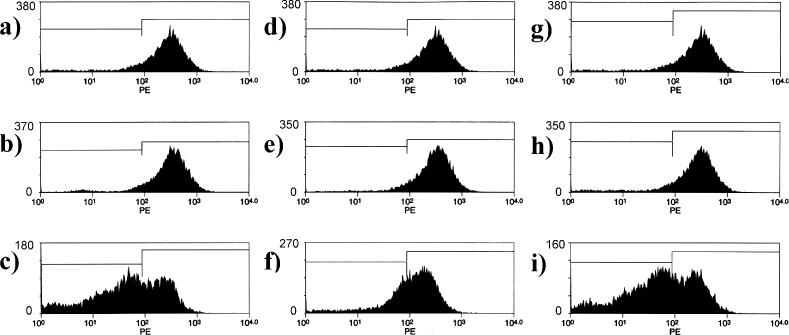
Figure 6.

Antisense effects on P-glycoprotein expression in NCI/ADR-RES cells. NCI/ADR-RES cells were treated with Lipofectamine 2000 complexes of various oligonucleotides, and cell surface P-glycoprotein expression in the viable cells was evaluated as described in Materials and Methods. x-Axes represent fluorescence intensity and y-axes represent cell population. Panels (A, D and G), controls (Lipofectamine 2000 only); (B) 9 nM HNA gapmer mismatched (GS1957); (C) 9 nM HNA gapmer (GS1956); (E) 9 nM phosphorothioate scrambled control (10 221); (F) 9 nM phosphorothioate (5995); (H) 9 nM 2′-O-ME gapmer scrambled (13 753) (I) 9 nM 2′-O-ME gapmer (13 758). The demarcations between the left and right boxes in the figures are set at one standard deviation below the mean of the untreated control.
