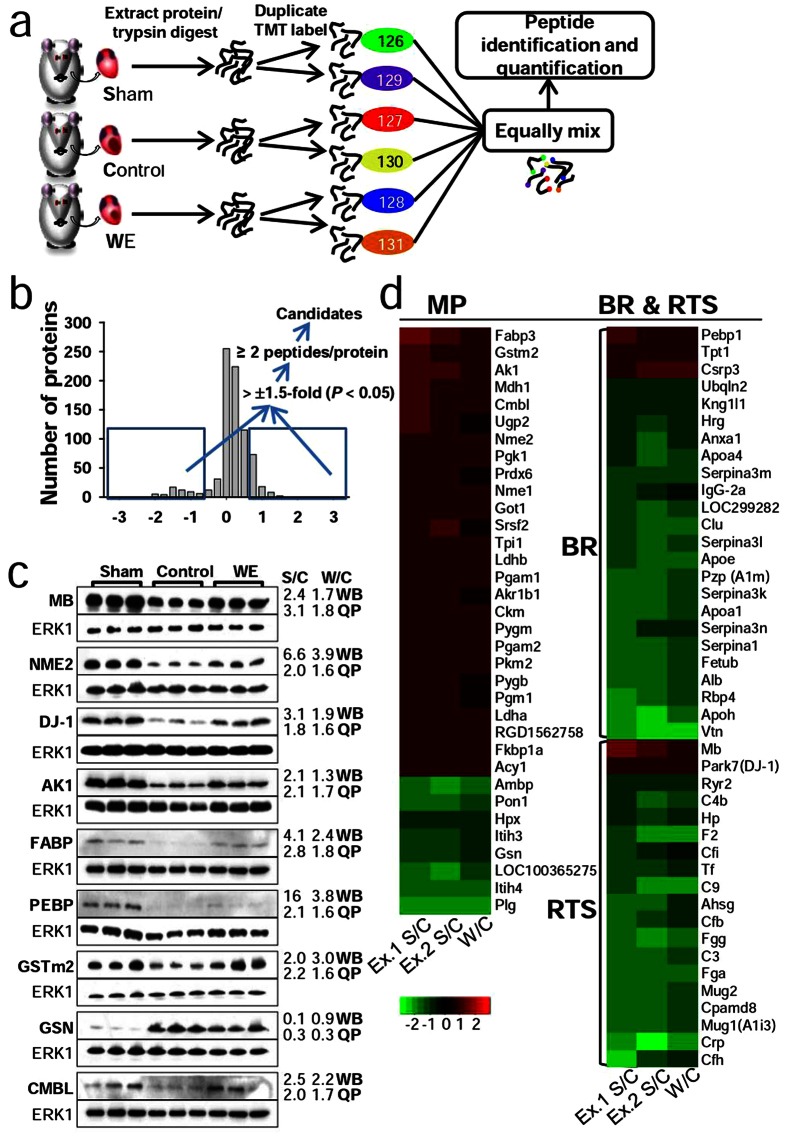
Figure 2. Quantitative proteomics analysis for the identification of proteins modulated by WE intake.
(a) Flow chart of the experimental scheme. In each experiment, peptide digests from the sham, control, and WE-treated group were individually labelled with two different TMT-sixplex tags to exclude technical variations. The labelled peptides were equally mixed and subjected to identification and quantification via tandem MS. (b) The scheme for candidate identification and log2 ratio plot for heart proteins obtained from the sham and control. (c) Representative Western blot results of 9 candidates (MB, NME2, DJ-1, FABP, AK-1, RKIP, GSTm2, CMBL, and GSN) and a loading control (ERK1). Immunoblotting was performed using the protein extracts from batches of rat heart tissues, which were different from those used for the TMT labelling experiments. Average fold changes of the quantitative Western blot (WB) results from biological triplicates and quantitative proteomics (QP). The original bands are presented in Supplementary Fig. S3. MB, myoglobin; NME2, nucleoside diphosphate kinase; FABP, fatty acid-binding protein; AK-1, adenylate kinase; RKIP, phosphatidylethanolamine-binding protein; GSTm2, glutathione S-transferase; CMBL, carboxymethylenebutenolidase; GSN, gelsolin. (d) Log2 heat map for overlapping candidates between the sham/control and WE/control data sets.

