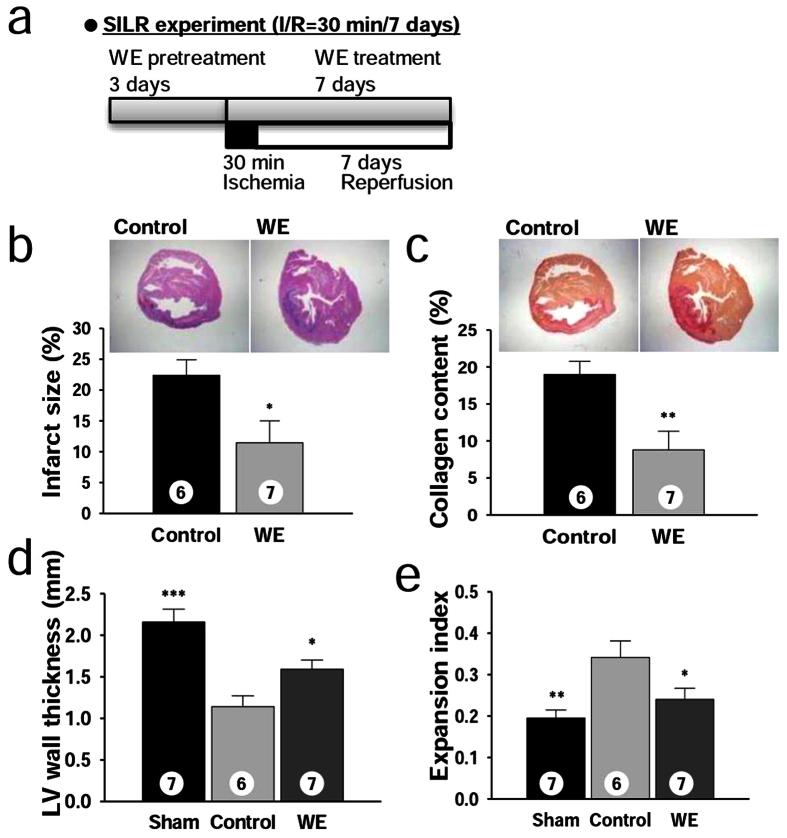
Figure 4. WE mitigates adverse LV remodelling after MI in the SILR model.
(a) Design of the SILR experiments with a WE dose of 400 mg/kg/day. (b) Representative sections stained with haematoxylin-eosin staining (top), and infarct size (bottom). (c) Representative sections stained with Sirius red (top), and collagen content presented as the stained area/left ventricular (LV) area. (d) Average LV wall thickness. (e) Expansion index. *P < 0.05, **P < 0.01, ***P < 0.001 compared with the controls. The numbers inside bars indicate the number of animals per group.

