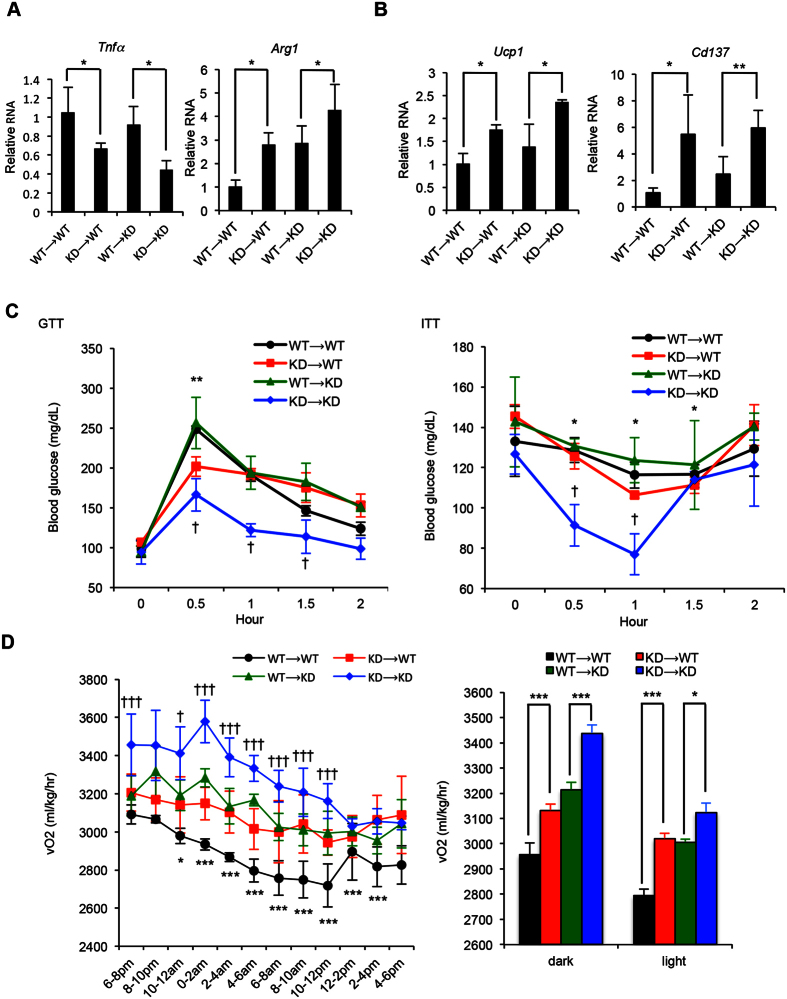
Figure 3. Receiving FMT from RIP140mϕKD mice ameliorates diet-induced diabetic traits.
(A) qPCR of Tnfa (M1) and Arg1 (M2) in visceral white adipose tissues. Student test (n = 3) was used and presented as mean ± SD, *P < 0.05. (B) qPCR of Ucp1 (brown fat) and Cd137 (beige fat) in visceral white adipose tissues. Student test (n = 3) was used and presented as mean ± SD, *P < 0.05; **P < 0.01. (C) GTT (left) and ITT (right) determined after 14 weeks of HFD feeding Student test (n = 3) was used and presented as mean ± SD, *P < 0.05, **P < 0.01 (WT → WT vs. KD → WT); †P < 0.05 (WT → KD vs. KD → KD). (D) Energy expenditure of FMT mice. O2 consumption was measured in the dark and light phases and presented as vO2 (ml/kg/hr) (n = 3 in each group). Student test was used and presented as mean ± SEM. *P < 0.05; **P < 0.01; ***P < 0.001 (WT → WT vs. KD → WT), †P < 0.05; ††P < 0.01; †††P < 0.001 (WT → KD vs. KD → KD).

