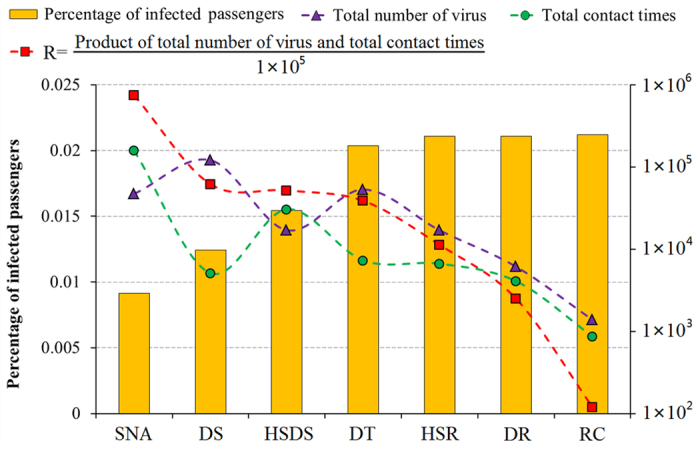
Figure 12. Relationship among percentage of infected passengers, total number of virus and total contact times based on the sensitivity analysis of disinfection of different surfaces.

(SNA: seat near the aisle; DS: sightseeing deck; HSDS: handrail of stairs to the sightseeing deck; DT: dining table; HSR: handrail of stairs to the restaurant; DR: doorknob of restroom; RC: Retail counter).
