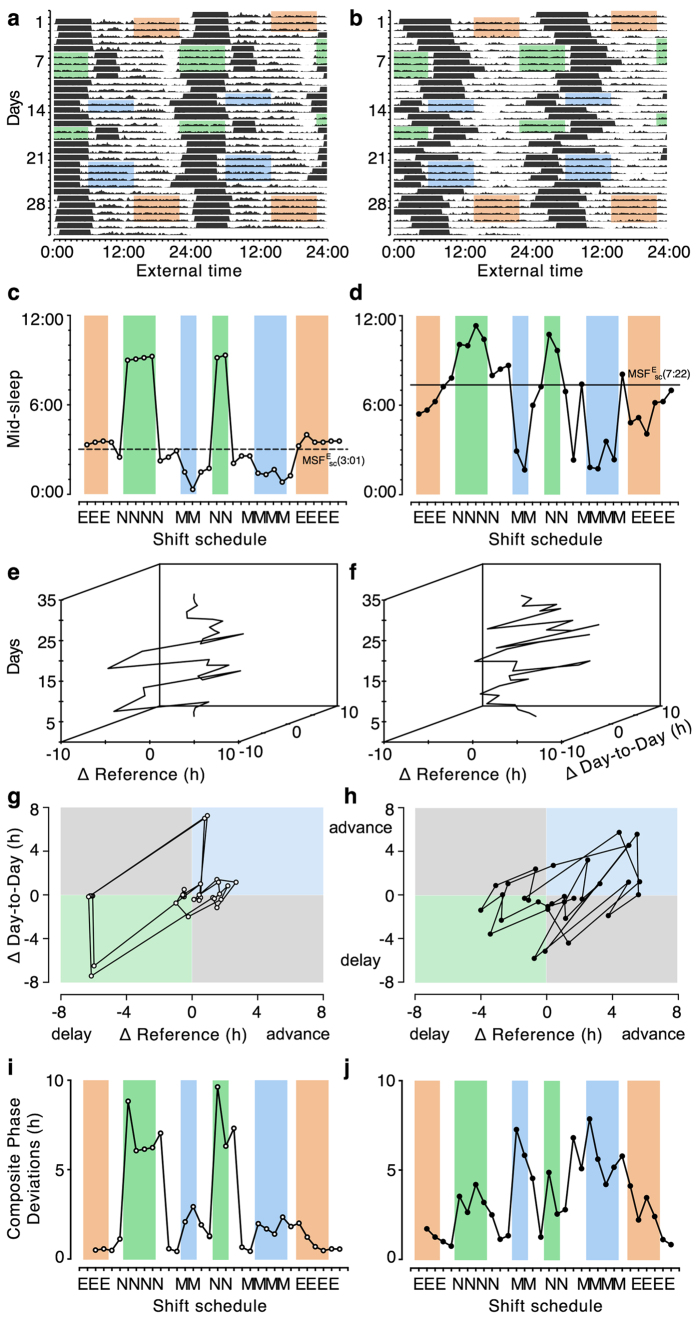
Figure 1. Composite Phase Deviations in shift workers.
Double-plots of activity over 4 weeks of an early chronotype (MSFEsc = 3:01; panels on the left) and a late chronotype (MSFEsc = 7:22; panels on the right). Black horizontal bars in panels a and b represent sleep bouts. Blue shading represents morning shifts (6 a.m.–2 p.m.), orange shading evening shifts (2 p.m.–10 p.m.), and green shading night shifts (10 p.m.–6 a.m.). Profiles in panels c and d represent mid-sleep times extracted from activity recordings (horizontal lines indicate individual chronotype, MSFEsc, based on activity-derived sleep times). Panels e,f show three- and panels g,h show two-dimensional ‘Δplots’ (see text for details) illustrating advances and delays throughout the shift schedule. Note that ΔReference in these examples refers to the difference between a given mid-sleep and the individual chronotype (MSFEsc); the latter is used as the reference measure but can be replaced by other variables assumed to reflect an optimum. Panels i and j show Composite Phase Deviations (vector lengths) calculated from Δplots.

