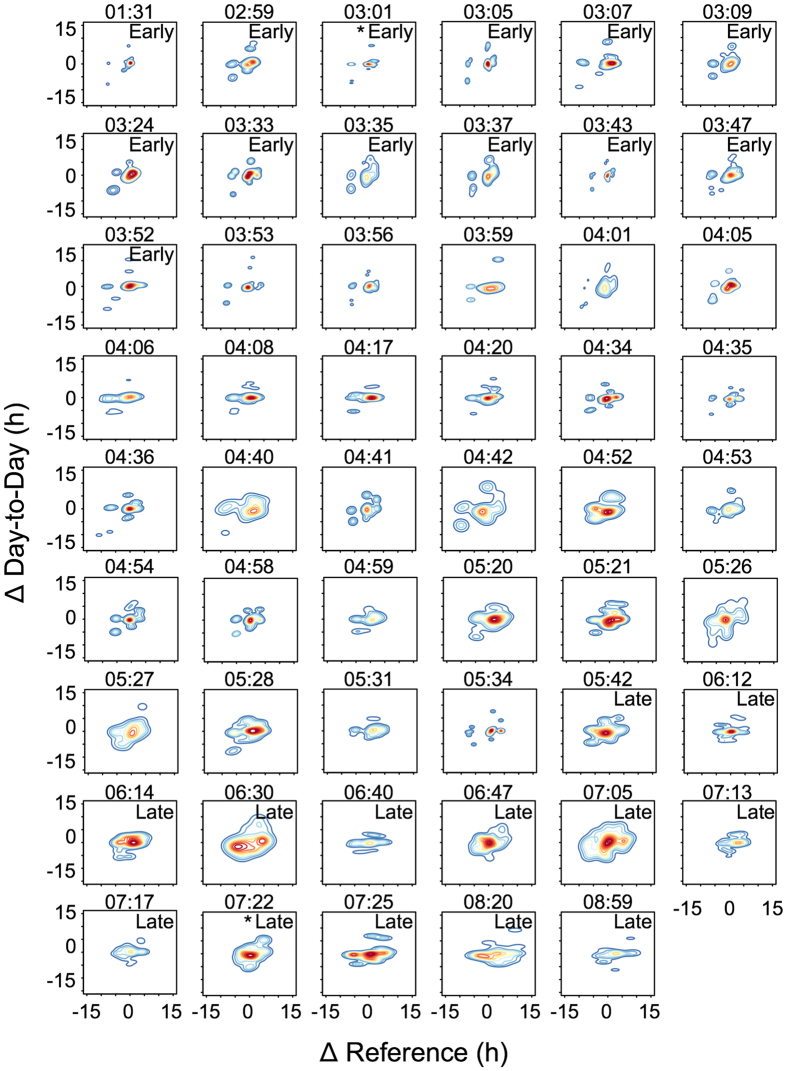
Figure 2. Density plots of shift workers ranked by chronotype (MSFEsc).
Panels labelled “Early” represent the earliest quarter of chronotypes (n = 13, MSFEsc < 3:53), and those labelled “Late” the latest quarter within the sample (n = 13, MSFEsc > 5:36). Individual corrected mid-sleep times (MSFEsc) are shown above each panel as local time. Asterisks mark the two individuals shown in Fig. 1. Colour codes range from dark blue (lowest density) to dark red (highest density). Note that the last intermediate chronotype (MSFEsc = 05:34) had a short recording period of 14 days possibly explaining the fragmented shape due to small number of data points. Mid-sleeps were extracted from activity recordings (see Methods for details). ΔReference refers to the difference between a given mid-sleep and the individual chronotype (MSFEsc); the latter is used as the reference measure but can be replaced by other variables assumed to reflect an optimum.

