
Figure 4. Relationship between work regime, chronotype and circadian misalignment.
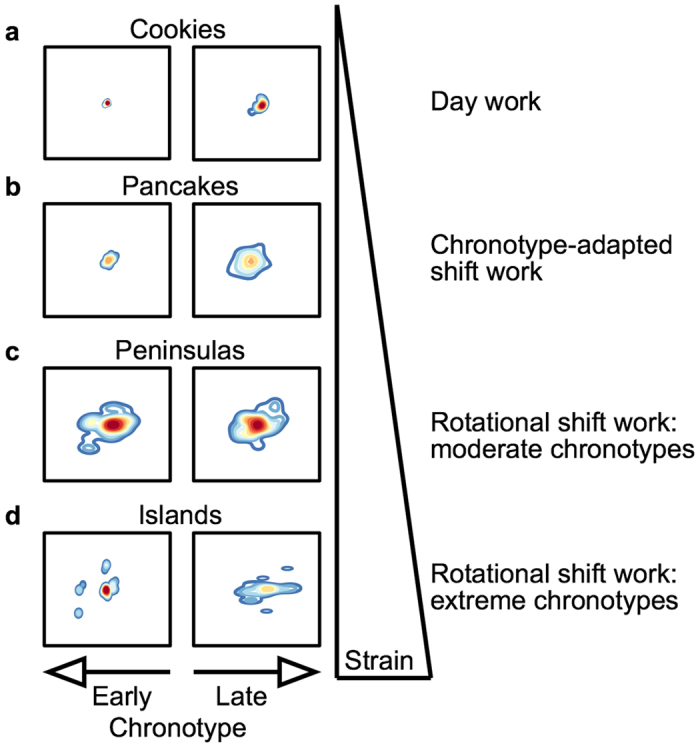
Depicted are density plots from individual shift workers and day workers shown before in Figs 2 and 3, respectively. Data for the chronotype-adapted shift schedule are taken from Vetter et al.39. Left panels show earlier chronotypes relative to right panels. MSFsc from top to bottom and left to right: 1:44 and 5:58, 3:09 and 6:37, 5:20 and 6:47, and 3:05 and 8:59. Note that the CPD value of an island (a single dot disconnected from the rest of the shape) usually represents the maximum value within an individual, and thus the most extreme form of misalignment. However, when CPD values are averaged for an entire shape (i.e., across the full study period), island shapes produce generally lower overall values than pancake shapes (compare panels c and d).