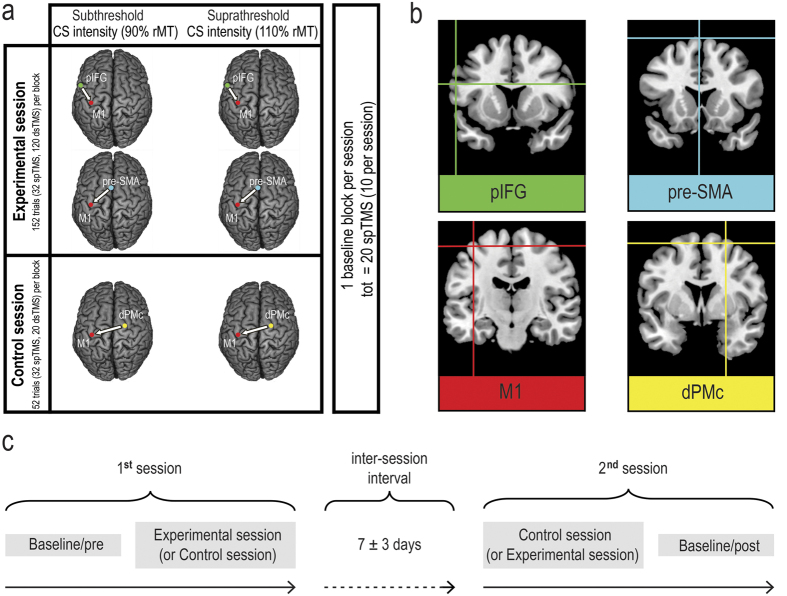
Figure 1.
(a) Schematic representation of the experimental and control sessions. For each experimental and control block, brain stimulation sites, CS intensity and number of trials are reported. The baseline consisted of a total of 20 spTMS trials, recorded during the experimental session (10 MEPs) and the control session (10 MEPs). The baseline trials were collected at the beginning or at the end of each session. (b) Brain stimulation sites. Coordinates in Talairach space corresponding to the projection of the stimulated scalp sites on the brain surface were estimated through neuronavigation software (left mean pIFG coordinates ± S.D.: x = −54.8 ± 1.3, y = 9.1 ± 1.0, z = 24 ± 1.0; pre-SMA: x = 0.1 ± 0.3, y = 9.8 ± 6.5, z = 67.9 ± 1.4; left M1: x = −38.3 ± 5.0, y = −19.4 ± 6.1, z = 58.7 ± 3.0; and right dPMc: x = 22.2 ± 6.8, y = −3.5 ± 7.2, z = 63.5 ± 7.4) and then reconstructed on a standard template using MRIcron software (v 1.40 http://www.mricro.com). (c) Experiment timeline.

