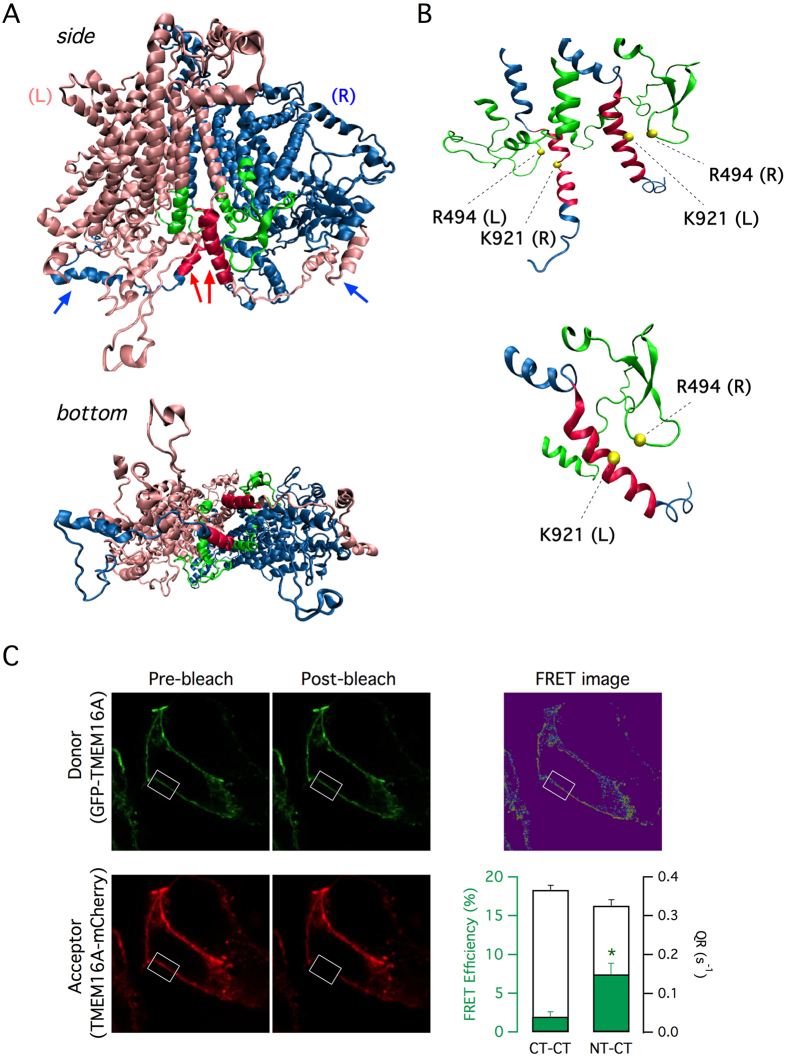
Figure 5. Homology model for TMEM16A protein.
(A) Side and bottom view of the TMEM16A homodimer. The left and right monomers are colored in magenta and blue respectively. C-termini from each side first meet at the center of the dimer (colored in red and indicated by red arrows). The C-termini then extend to the other side of the dimer and take contact with the N-terminus of the opposite subunit (blue arrows). (B) Close view of the two C-termini and the two first intracellular loops. The position of the residues R494 and K921 (subsequently mutagenized to cysteines in Fig. 6) are indicated. (C) Results from acceptor photobleaching FRET experiments. Representative images show fluorescence of GFP and mCherry fused to the N-terminus and C-terminus of TMEM16A, respectively (NT-CT configuration). Images were taken before and after bleaching the acceptor (mCherry) in the area indicated by the rectangle. The green bars in the graph show the calculated FRET in experiments with NT-CT or CT-CT configuration (GFP and mCherry both fused to the C-terminus). *p < 0.05 vs. CT-CT, n = 15 experiments. The white bars in the graph show QR from HS-YFP experiments; both NT-CT and CT-CT configurations generate functional TMEM16A channels.

