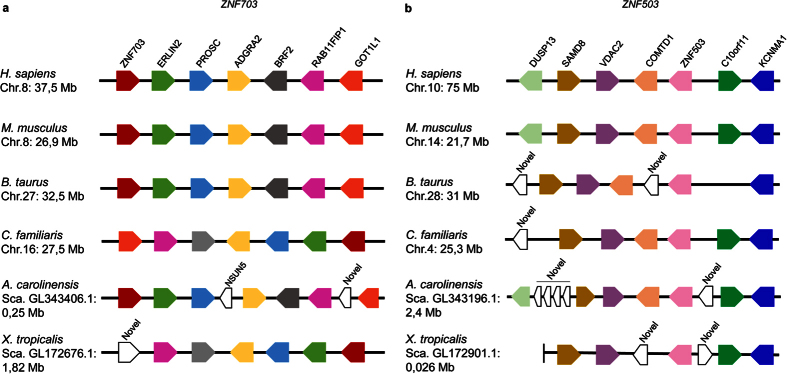
Figure 5.
Synteny conservation around ZNF703 (a) and ZNF503 (b) genomic regions in six representative species of tetrapods. The schemes show the relative position and orientation of the NET family and neighbouring genes. The sizes and distances between genes are not to scale. Numbers indicate chromosomal (Chr.) or scaffold (Sca.) locations in megabases (Mb) of the first gene analysed. Colour code represents orthologous relationship among genes. In (b) the scaffold of X. tropicalis terminates after SAMD8, which is indicated by a vertical line.

