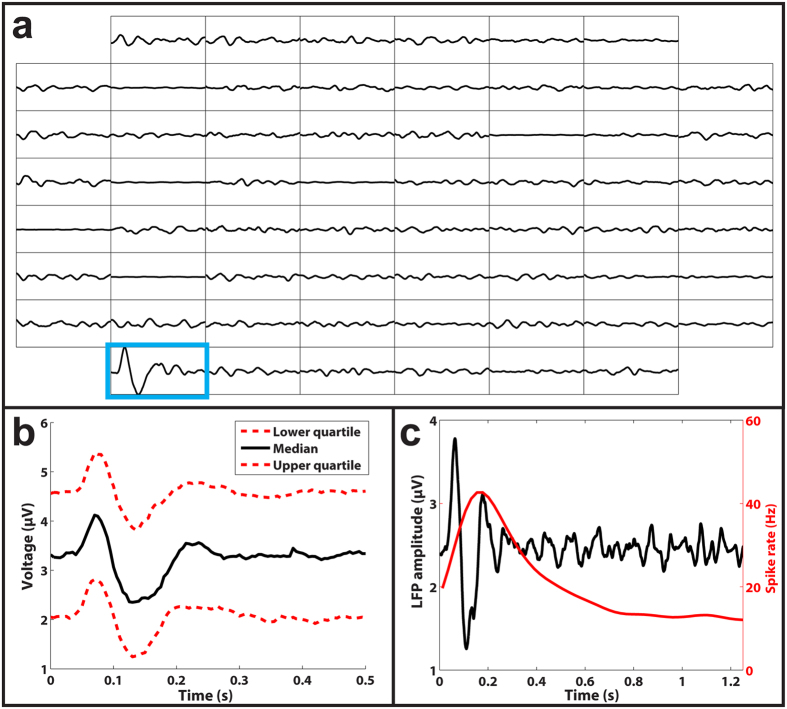
Figure 3. Subretinal glutamate injections elicited robust LFP responses.
(a) Representation of LFPs recorded from each of the 60 electrodes (interelectrode distance of 200 μm). The only trace that shows a significant LFP response (outlined in blue) corresponds to the electrode where glutamate was injected. (b) The lower (bottom red), median (black), and upper (top red) quartile gLFP responses show a characteristic triphasic shape. (c) An overlay of the LFP (black) and spike rate (red) responses from a representative ON RGC, demonstrating that LFP responses preceded spike rate responses.

