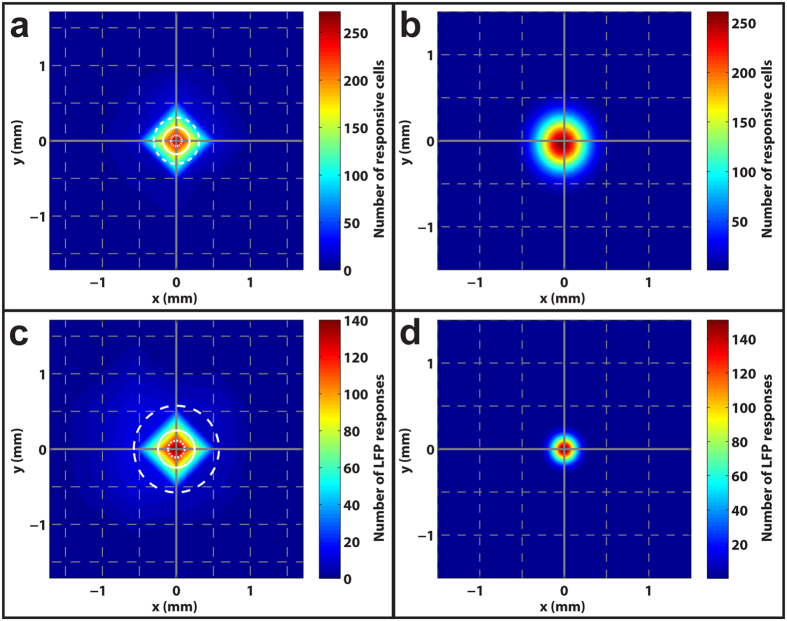
Figure 4. Subretinal injections elicit localized RGC responses.
(a) A two-dimensional histogram displaying the location of all RGC receptive field centers relative to the injection site (midpoint) that were responsive to glutamate injected below the photoreceptor surface. The solid white circle indicates the median distance of 180 μm while the inner and outer dotted/dashed circles specify the lower (75 μm) and upper (310 μm) quartiles, respectively. Warmer colors represent higher densities of RGCs as quantified by the color bar on the right. The grey gridlines are separated by distances of 500 μm. (b) The data in (a) were fitted with 2D Gaussian functions to produce a more continuous spatial distribution than predicted in (a). The Gaussian fit predicts a median spread of 230 μm for subretinally injected glutamate. (c,d) Two-dimensional histograms showing the spatial distribution and Gaussian fit for LFP responses, which yielded median distances of 245 and 105 μm, respectively.

