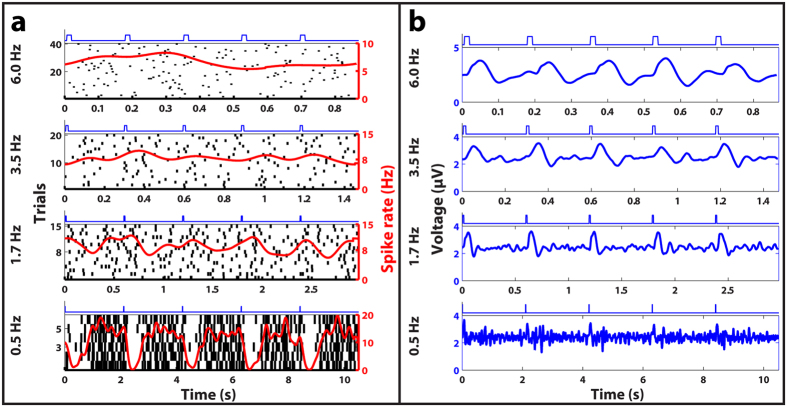
Figure 5. Frequency responses of subretinal glutamate stimulation.
(a) Representative raster plots of spike discharge for an OFF RGC. (b) LFP plots recorded from an electrode near the OFF RGC in response to glutamate injections delivered at four different frequencies (indicated on the far left). Each plot shows the average responses to multiple trials, where each trial consisted of 5 consecutive 10 ms glutamate injections whose timing is represented by the blue square waves above each subplot. Glutamate injections delivered as fast as 3.5 Hz produced discernable spike rate responses, while injections at the highest frequency (6 Hz) tested elicited robust LFP responses.

