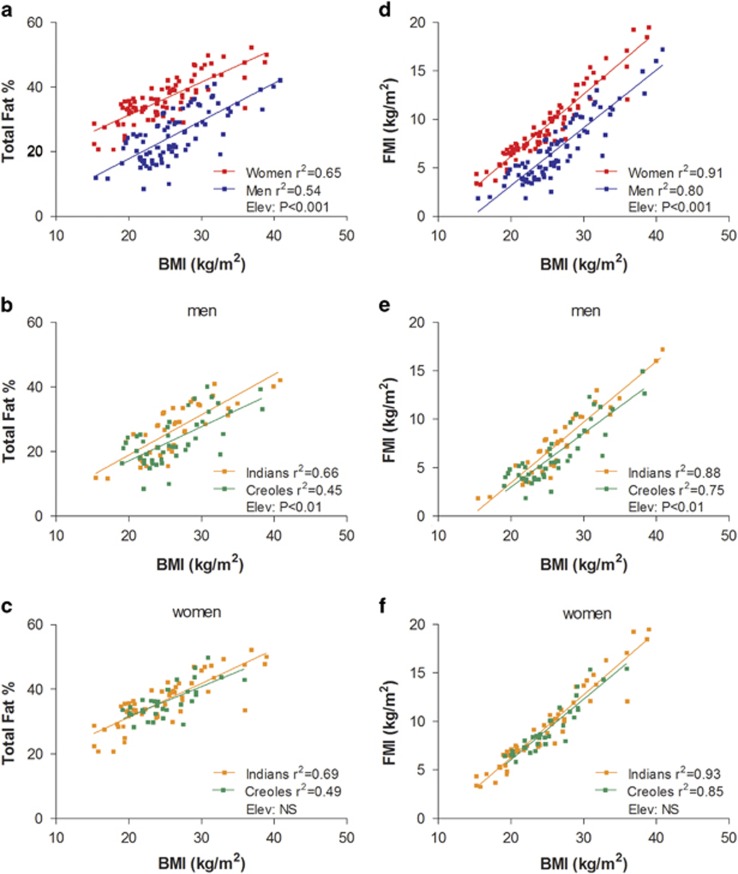
Figure 1.
Relationship between total body fat% measured by D2O dilution technique and BMI according to gender (a) and ethnicity in men (b) and women (c). (d–f) The relationship between body fat adjusted for height2, that is, FMI and BMI according to gender and ethnicity in men and women, respectively. Elev: statistical significance of differences in the elevation between regression lines, that is, in their y-intercepts; NS: no significant difference. The regression equations from BMI–Fat% relationship are as follows: (a) for men; %Fat=−5.52+(1.168 × BMI); for women, %Fat=10.868+(1.023 × BMI). (b) for men; Indian: %Fat=−6.06+(1.250 × BMI); Creole: %Fat=−3.98+(1.055 × BMI). (c) for women; Indian: %Fat=10.34+(1.05 × BMI); Creole: %Fat=13.06+(0.926 × BMI). The regression equations from BMI–FMI relationship are as follows: (d) for men; FMI=−8.75+(0.596 × BMI); for women, FMI=−6.64+(0.641 × BMI). (e) for men; Indian: FMI=−9.10+(0.627 × BMI); Creole: FMI=−8.09+(0.555 × BMI). (f) for women; Indian: FMI=−6.69+(0.648 × BMI); Creole: FMI=−6.39+(0.623 × BMI).

