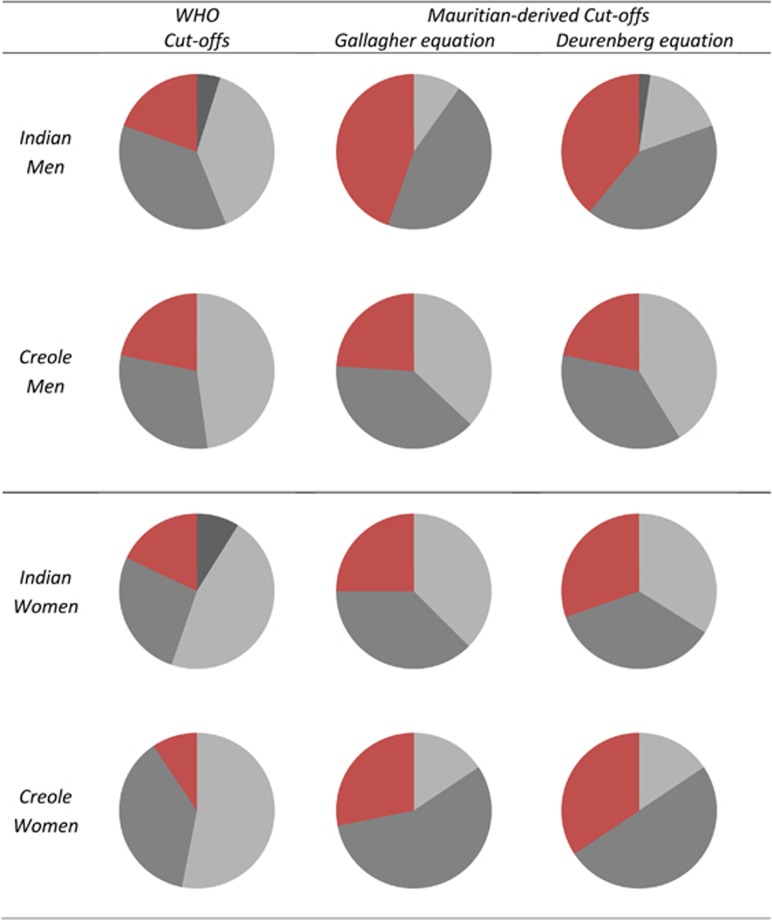
Figure 5.
Pie charts showing the proportions of the Mauritian population studied here (n= 175) who are underweight (UW, black shading), normal weight (NW, light gray shading), overweight (OW, dark gray shading) and obese (OB, red shading) according to WHO cut-offs for BMI or according to BMI cut-offs for BMI derived from Mauritian ethnic-specific BMI–Fat% relationship (with fat% measured by D20 dilution technique) and using either the Gallagher et al.18 equation or the Deurenberg et al.16 equation.

