Figure 5.
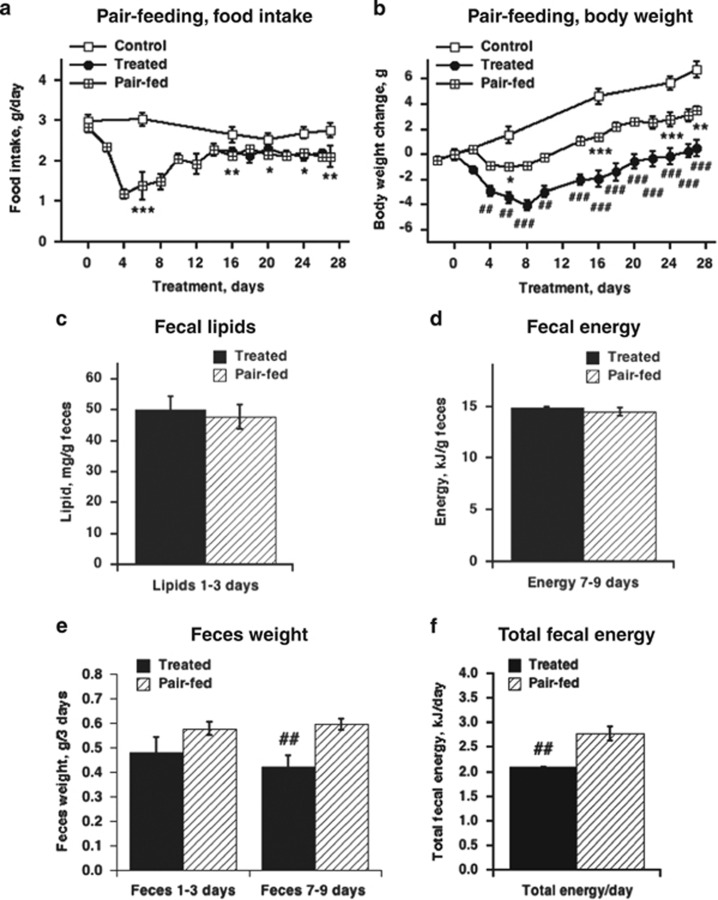
Food intake-independent effects of C12TPP in wild-type mice on a HFD at thermoneutrality. Time course of food intake (a) and body weight change relative to day 0 (b) of control, C12TPP-treated mice and mice pair-fed with the treated group. Treatment and pair-feeding started on day 0 and finished on day 27. The values are the means±s.e.m. of six to seven mice per group. The effects for overlapping time points with the control were statistically analyzed with a repeated measures two-way analysis of variance (ANOVA): for both a and b (time: P<0.0001; treatment: P<0.0001; interaction P<0.001). The effects for overlapping time points for treated and pair-fed mice was statistically analyzed with a repeated measures two-way ANOVA for a: the food intake in pair-fed group was pre-defined and cannot be included in the ANOVA; for b (time: P<0.0001; treatment: P<0.0001; interaction P<0.001). *Significant differences between the pair-fed and control groups. #Significant differences between the pair-fed and treated groups. The difference between the control and treated groups is not shown. (c and d) Lipid and energy contents of feces. A lipid analysis (c) was performed on feces from the first 3 days of treatment and bomb calorimetry was used to estimate the energy (d) content of feces from 7 to 9 days of treatment. Bars represent the mean±s.e.m. of four to six mice per group. (e) Amount of feces produced during the first three days (1 to 3) and 7 to 9 days of treatment. Bars represent the mean±s.e.m. of five to six mice per group. The data were statistically analyzed with a repeated measures two-way ANOVA: (treatment: P<0.001; days ns; interaction ns). #Significant differences between the pair-fed and treated groups. (f) Total fecal energy per day of C12TPP treatment. The fecal energy (as in d) was multiplied by the amount of feces (as in e) and this amount was divided by 3 days. Bars represent the mean±s.e.m. of five to six mice per group. The data were analyzed with Student's t-test and # indicates significant differences between the pair-fed and treated groups.

