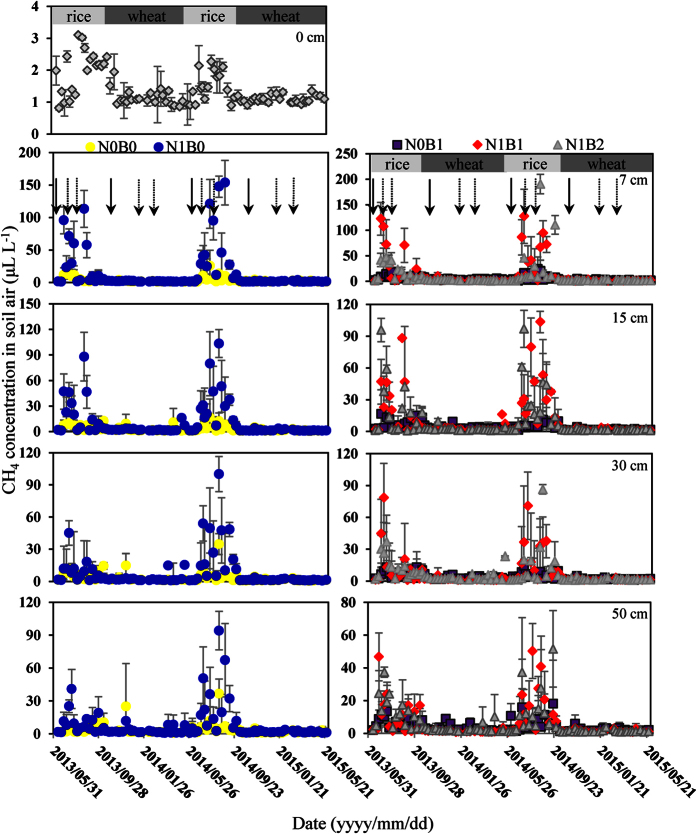
Figure 1. Seasonal dynamics of CH4 concentrations at different soil depths in the rice-wheat annual rotation system, with different N and biochar additions.
The error bars show the standard deviations (n = 3). The solid and dashed arrows indicate basal fertilization and topdressing, respectively. N0B0 (no nitrogen (N) and biochar (B) amended) as control, N0B1 (only biochar amended, 20 t hm−2), N1B0 (only N fertilizer amended, 250 kg hm−2 urea), N1B1 (250 kg hm−2 urea and 20 t hm−2 biochar amended), and N1B2 (250 kg hm−2 urea and 40 t hm−2 biochar). The concentration of CH4 at 0 cm was used as the mean surface air sample which close to the background atmospheric value at the sampling time.

