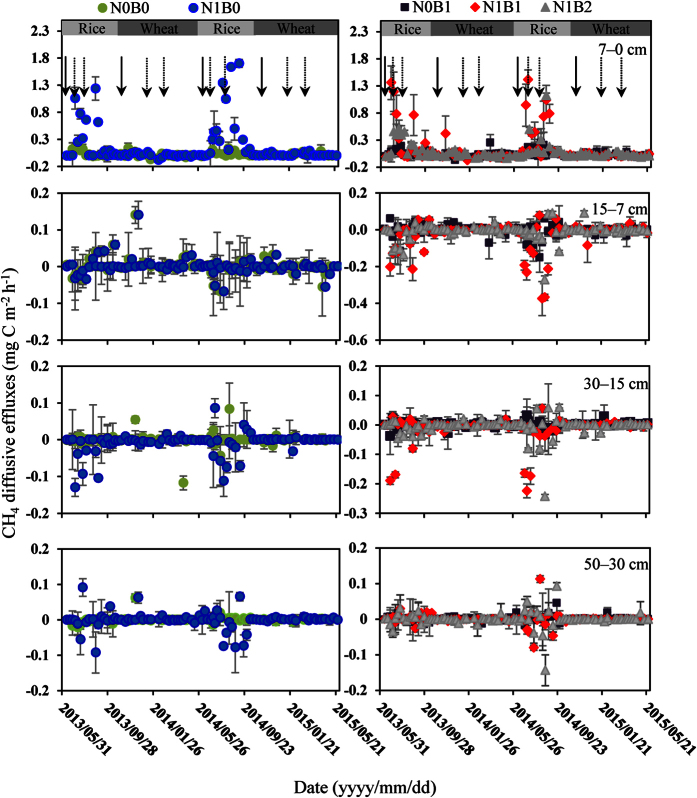
Figure 3. Seasonal dynamics of CH4 diffusive effluxes at different soil depths in the rice-wheat annual rotation system, with different N and biochar additions.
The error bars show the standard deviations (n = 3). The solid and dashed arrows indicate basal fertilization and top-dressing, respectively.

