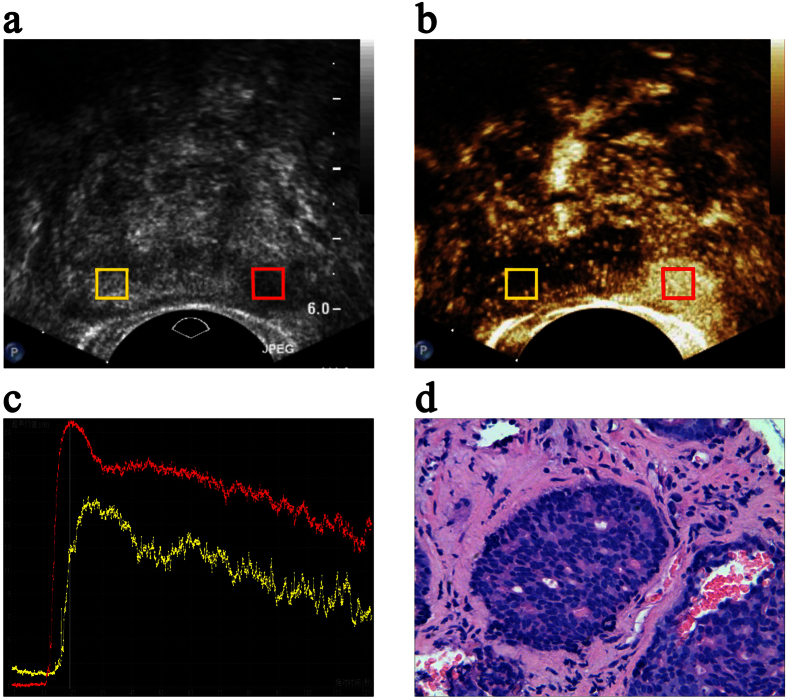
Figure 1. The region of interest (ROI) settings, time-intensity curve (TIC) analysis and oncological outcomes.
Transverse (a) greyscale and (b) contrast-enhanced transrectal ultrasound mapping of the prostate in a 67-year-old patient. The red box indicates the ROI placed in the nodule lesion, and the yellow box indicates the corresponding ROI placed in the normal peripheral zone (PZ). (c) The red and yellow lines in the TICs represent the perfusion characteristics of the ROIs of the nodules and the normal PZ, respectively. (d) The oncological outcomes following biopsy show an adenocarcinoma.

