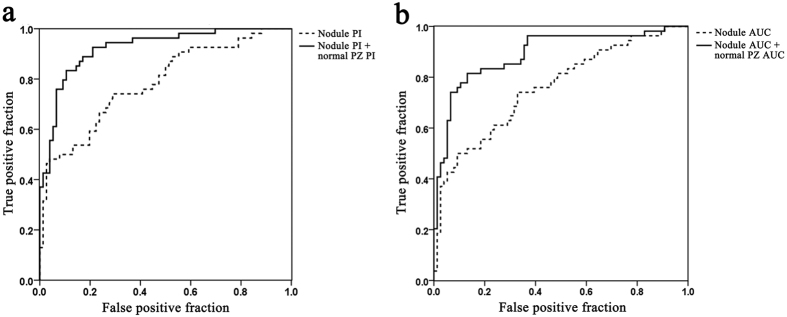
Figure 2. Receiver operating characteristic curve of the regression models based on Eq. (3).
The solid line shows the diagnostic accuracy when the model incorporates (a) the normal peripheral zone (PZ) peak intensity (PI) in addition to the nodule PIs and (b) the normal PZ area under the curve (AUC) in addition to the nodule AUCs. The dotted line shows the diagnostic accuracy of (a) nodule PIs only and (b) nodule AUCs only.

