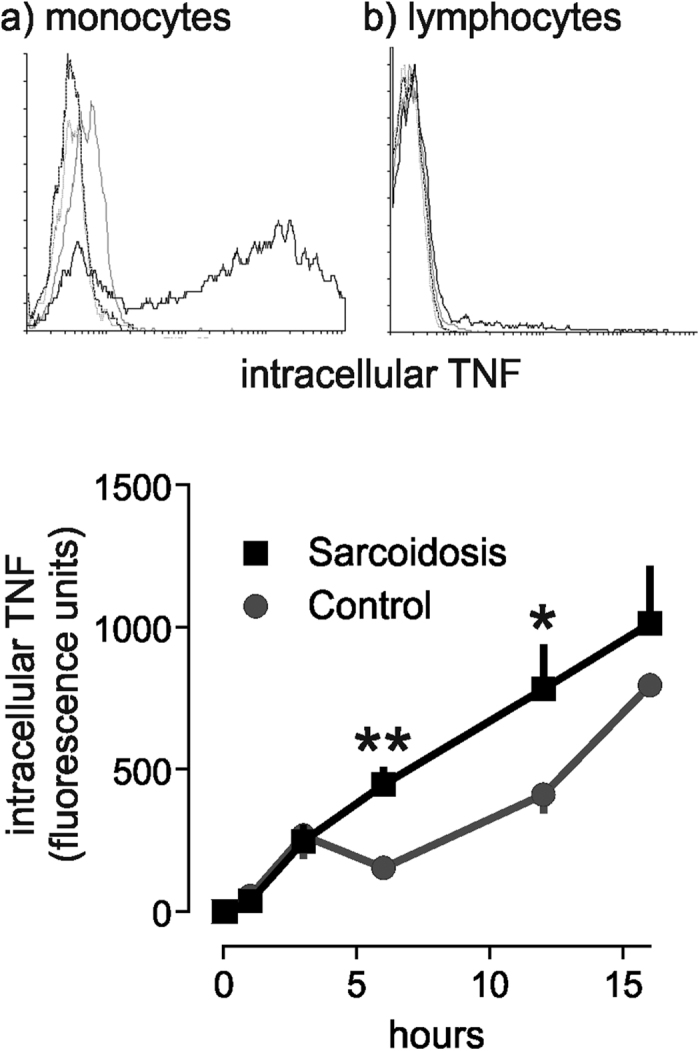
Figure 3. TNF production by monocytes is increased in sarcoidosis.

Representative flow cytometry histograms showing intracellular TNF accumulation in (a) monocytes and (b) lymphocytes after incubation with PHA for 16 hours. Dark grey line, unstimulated isotype control antibody; light grey, unstimulated TNF; solid black, PHA stimulated TNF. x axis, TNF fluorescence intensity; y axis, number of events. (c) Intracellular TNF accumulation in monocytes in response to 10 μg/ml PHA in patients with sarcoidosis and controls (n = 3). Results are presented as mean ± SEM geometric mean fluorescence intensity; *p < 0.05, **p < 0.01 using two-way ANOVA with Bonferroni’s post hoc test.
