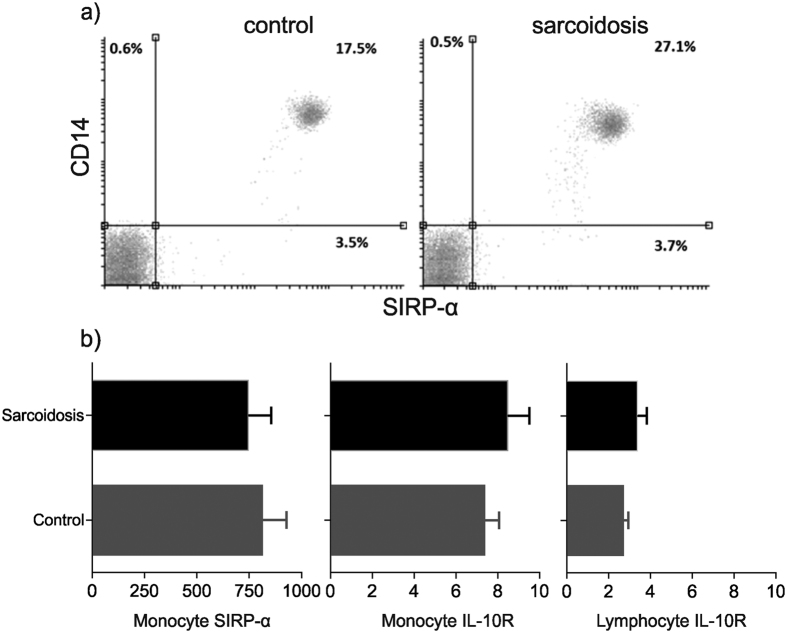
Figure 5. SIRP-α and IL-10R expression is similar in sarcoidosis patients and controls.
(a) Representative flow cytometry dot plots showing SIRP-α/β expression on monocytes in a healthy control subject and a patient with sarcoidosis. (b) Expression of SIRP-α/β and IL-10R on monocytes and T lymphocytes in sarcoidosis patients (n = 9) compared with controls (n = 10). Results are presented as mean ± SEM geometric mean fluorescence intensity; P = NS using Mann-Whitney U test.

