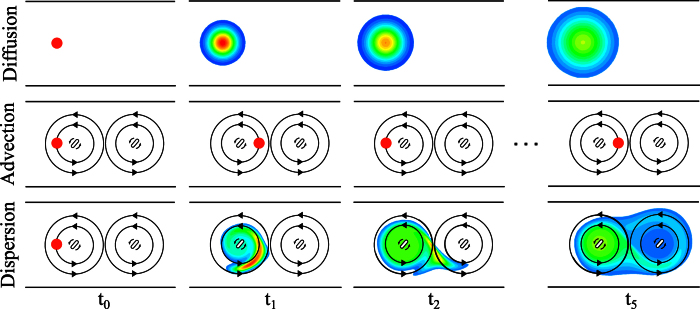
Figure 1. Illustration of the differences between solute transport by diffusion, advection and dispersion in the absence of net flow.
In this hypothetical setup, which is not meant to represent paravascular transport, a drop of solute (red circle) is injected into a fluid filled channel at time t0 (left column). In the top row, the fluid is still and the solute may solely be transported by diffusion, whereas in the two other conditions (advection, middle row, and dispersion, bottom row), two stir bars rotating counterclockwise induce a continuous fluid motion with zero net flow. The temporal evolution of the solute concentration (red: high, blue: low concentration, white: no solute) is illustrated in the following columns at equally spaced time points, ti = 0…5. Pure diffusion leads to slow solute transport. Advection by itself moves the solute much faster, but, in absence of any diffusion, confines the drop to the influence region of the first stir bar. In contrast, the combined effects of advection and diffusion, i.e. dispersion, result in fast solute transport from left to right, even though there is no (time-averaged) net flow of the liquid.

