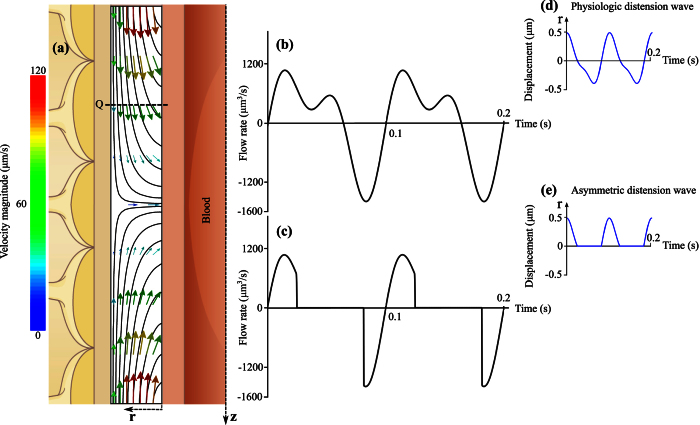
Figure 3. Fluid motion induced by vascular pulsation in a representative segment of arterial PVS of 150 μm length and 10 μm width.
(a) Illustration of instantaneous flow field in the segment at the beginning of the pulsation cycle as shown in panel d. Depicted are streamlines and velocity vectors color coded according to velocity magnitude. While the highest speed shown in this figure is 120 μm/s, the maximum value reached throughout the cycle is 276 μm/s. (b) Flow rate induced by physiologic arterial pulsation measured at plane Q indicated in panel a. While instantaneous flow rates of up to 1590 μm3/s are observed, the net flow rate averaged over one cycle is only 0.372 μm3/s. (c) Flow rate induced by an artificial, asymmetric distension wave as shown in panel e. This wave was derived from the physiologic one shown in panel d by setting all negative displacements to zero. The goal was to obtain the highest possible flow rate without changing the wave amplitude, frequency and length. The net flow rate measured at plane Q is 1.179 μm3/s, thus still very small.

