
Figure 4. Transport of solutes in the arterial PVS in the presence (green lines and symbols) and absence (black lines and symbols) of arterial pulsation.
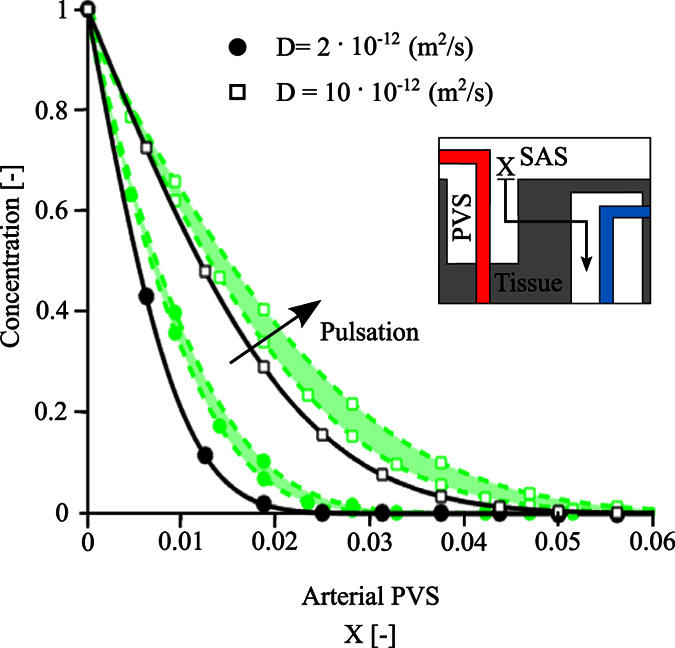
Solutes with diffusion coefficients of 2 · and 10 · 10−12 m2/s are considered (circles and squares, respectively). Symbols show the concentration profiles obtained from the 3D axisymmetric simulations 10 seconds after the entrance of solutes from the arterial PVS-SAS interface at X = 0. Lines illustrate the best fit curves obtained for the diffusion (continuous black lines) and dispersion (dotted green lines) cases. As dispersion effects depend on domain length, dispersion results are reported for a bifurcation-free arteriole segment length spanning 150 μm (lower bound of the shaded area) to 250 μm (upper bound). The effect of arterial pulsation can be approximated by the analytical solution of the dispersion equation (equation (5)) without having to account for pulsation explicitly. Corresponding dispersion curves (dotted lines) obtained using dispersion coefficients of 3.5 · and 4.2 · 10−12 m2/s (lower and upper green circles) and 12.7 · and 17.0 · 10−12 m2/s (lower and upper green squares) accurately reproduce the effect of pulsation (coefficient of determination: R2 > 0.99).