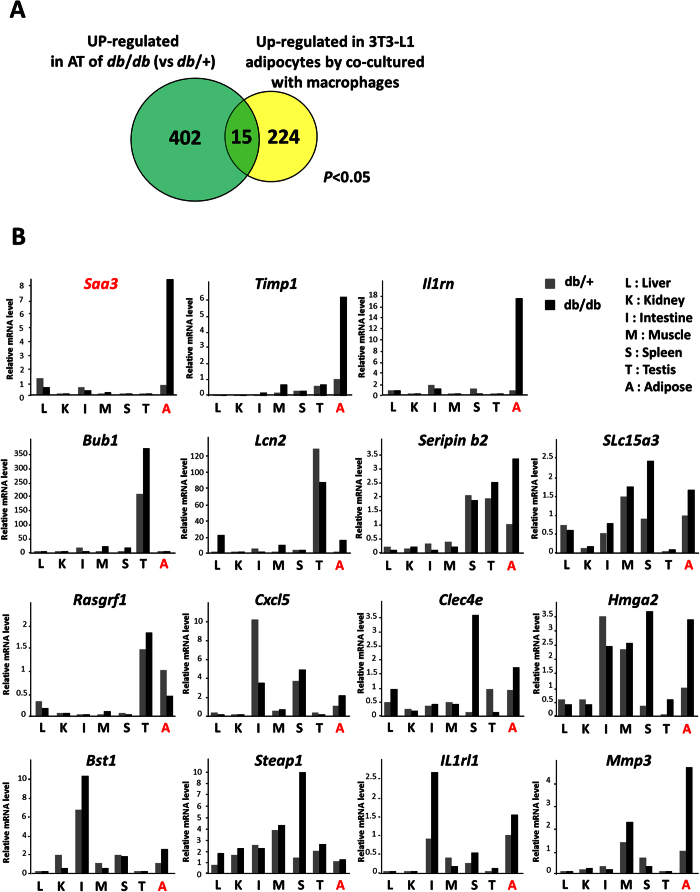
Figure 1. Analysis of two transcriptomes isolates Saa3 gene whose expression is upregulated by the interaction with macrophages.
(A) The venn diagram shows genes that are upregulated in the db/db white adipose tissue and up-regulated in 3T3-L1 adipocytes by the interaction with activated RAW264.7 macrophages. Of a total 402 genes up-regulated in db/db adipose tissue, the expression of 15 genes was also increased in 3T3-L1 adipocytes by the interaction with activated macrophages (p < 0.05). (B) Total RNAs from several types of tissue of db/+ and db/db mice were isolated. The relative mRNA expression level of each gene was determined by quantitative PCR and normalized to L19 mRNA level. The data are representative of two independent experiments.

