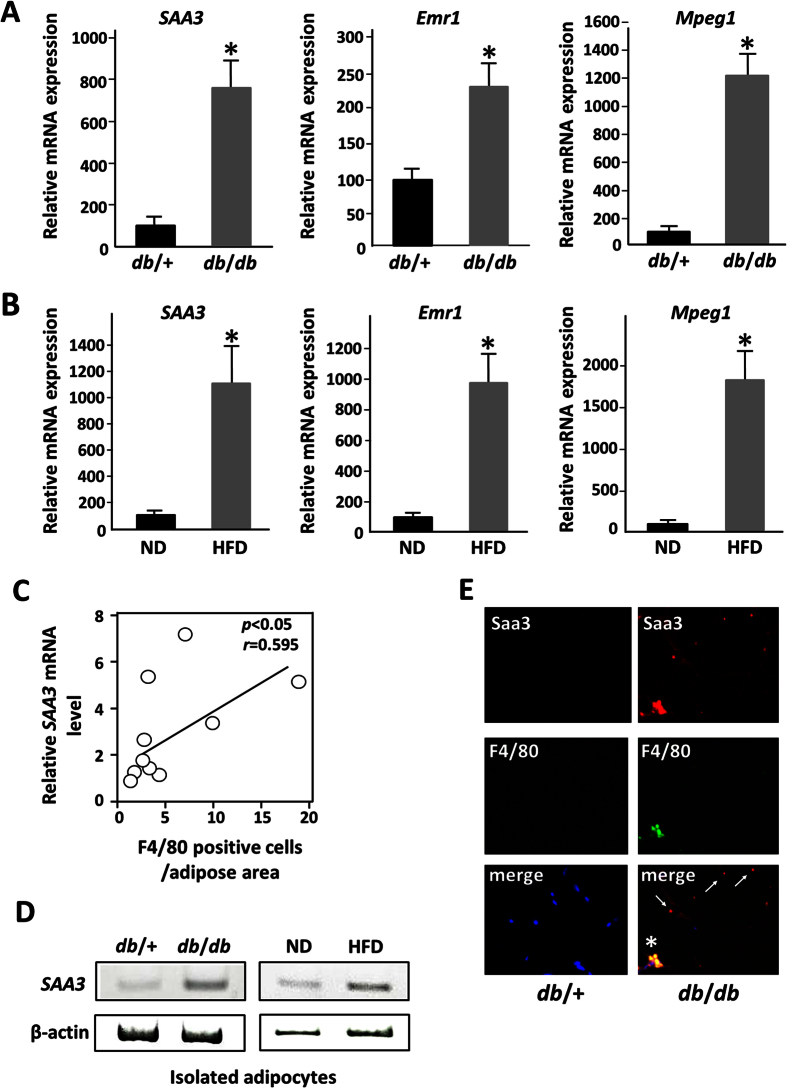
Figure 2. Saa3 gene expression in adipocytes is up-regulated by the interaction with macrophages.
(A) Total RNAs from individual mice (n = 3) were subjected to quantitative PCR. Values are normalized to L19 mRNA level. *p < 0.05 compared with that of control mice (db/+). The data (mean ± S.E.) are representative of two independent experiments. (B) Mice were divided into two groups (n = 4), and fed basal diet (ND) or a high-fat diet (HFD) for 16 weeks. The relative mRNA expression level of each gene was determined by quantitative PCR and normalized to L19 mRNA level. *p < 0.05 compared with that of mice with normal diet (ND). The data (mean ± S.E.) are representative of two independent experiments. (C) The relative mRNA expression level of Saa3 gene in adipose tissue of mice fed HFD (n = 12) was determined by quantitative PCR and normalized to β-actin mRNA level. Pearson’s correlation coefficient showed a positive correlation between Saa3 mRNA level and number of F4/80 positive cells in adipose tissue of mice fed HFD. (D) Mature adipocytes were isolated from white adipose tissue of db/+, db/db, ND and HFD mice as described under “Materials and Methods”. Semiquantitative RT-PCR was performed to determine mRNA levels of Saa3 and β-actin. (E) An immunohistochemical study was carried out using 7-μm-thick paraffin-embedded sections of the epididymal adipose tissue from db/db mice for the macrophage marker F4/80 (Serotec, Oxford, UK), followed by Alexa Fluor 488-labeled anti-rat IgG. The rabbit Saa3 antibody was visualized with Cy3-labeled anti-rabbit IgG. The nuclei were stained with 4′,6-diamidino-2-phenylindole (blue). Saa3 protein was co-localized with F4/80 (*) and also seen within vesicle-like structures in adipocytes (arrows).

