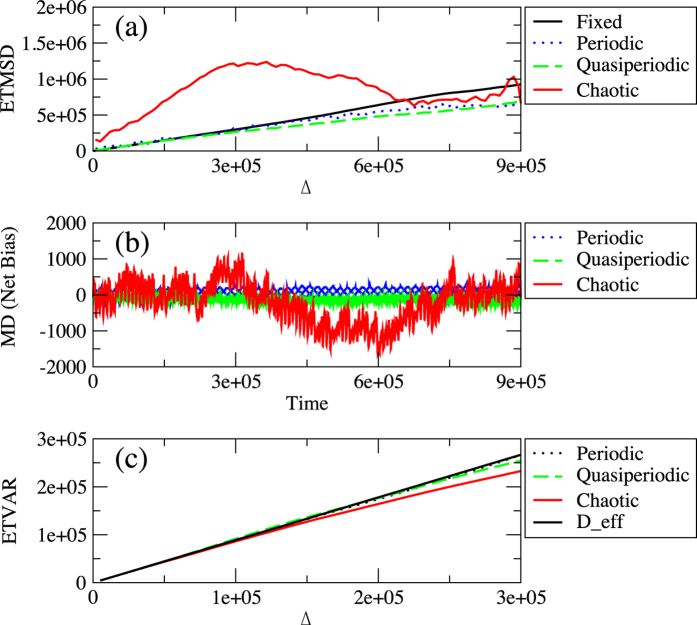
Figure 1. Diffusivity and bias in random walks with a fluctuating bias.
(a) Ensemble average of the time-averaged mean square displacements, where the bias sequences are generated by fixed (black solid line), periodic (blue dotted line), quasi-periodic (green dashed line), and chaotic (red solid line) time series. (b) Average difference between the number of right and left jumps until time t, i.e. mean displacement (MD) (‘net bias’). (c) Ensemble average of the time-averaged variances, where the bias sequences are generated by periodic (blue dotted line), quasi-periodic (green dashed line), and chaotic (red solid line) time series, and the black solid line represents the theory: ETVAR (Δ) = DeffΔ.

