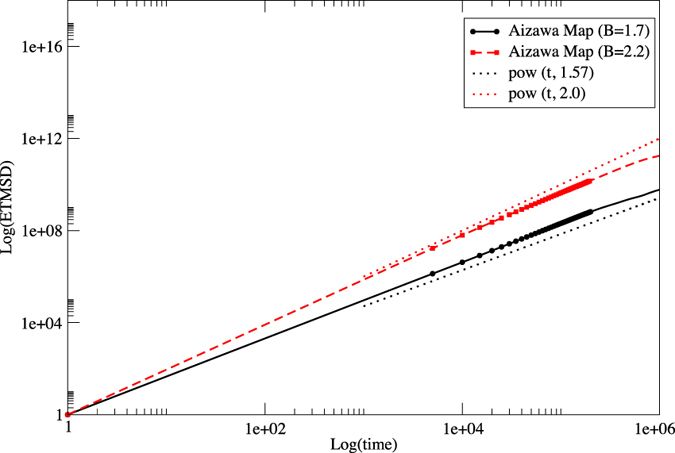
Figure 3. ETMSDs of a random walk using a time series generated by an Aizawa map with B = 1.7 (black circles) and B = 2.2 (red squares).

The slope of each ETMSD indicates superdiffusion, which is very close to the expected value (1.57 or 2.0) from our theory.
