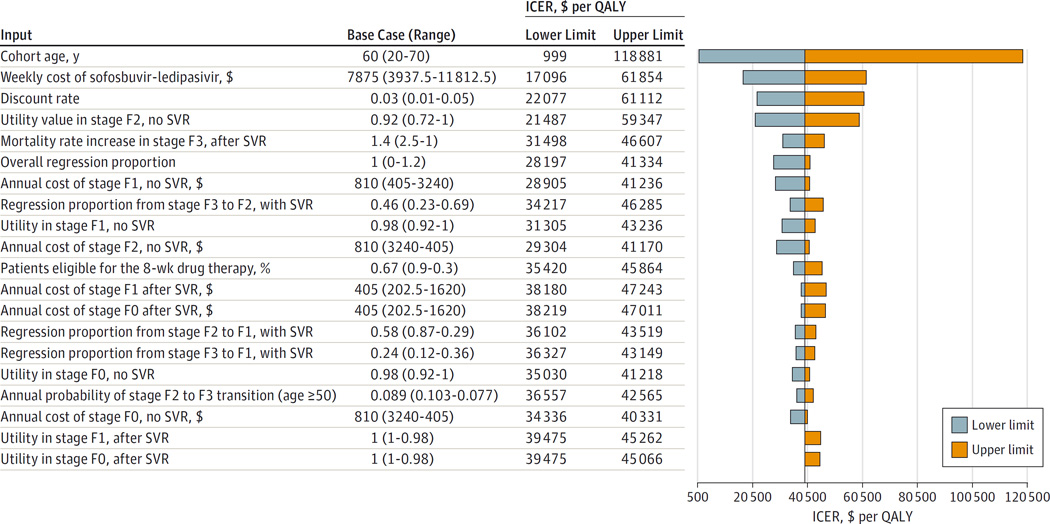
Figure 2. Sensitivity Analyses of Incremental Cost-effectiveness Ratios (ICERs) for Combined Sofosbuvir and Ledipasvir Treatment for All Stages of Fibrosis vs Stages F3 and F4.
The tornado diagram depicts 1-way sensitivity analyses for the inputs with the greatest effect on the ICER. Bars to the right of the base-case ICER ($39 475 per quality-adjusted life-year [QALY] gained, represented by the vertical line) indicate an increase in the ICER relative to the base case to the upper limit of the input variable; bars to the left indicate the inverse. For example, as age increases from 20 years through the base-case age of 60 years to 70 years, the ICER increases. A high-to-low order of the range, as for the annual cost of treating stage F0 disease and no sustained virologic response (SVR), indicates an inverse relationship between the input value and the ICER. Fibrosis is measured using the METAVIR stages (described in the Model Overview subsection of the Methods section). Drug therapy indicates sofosbuvir-ledipasvir.

