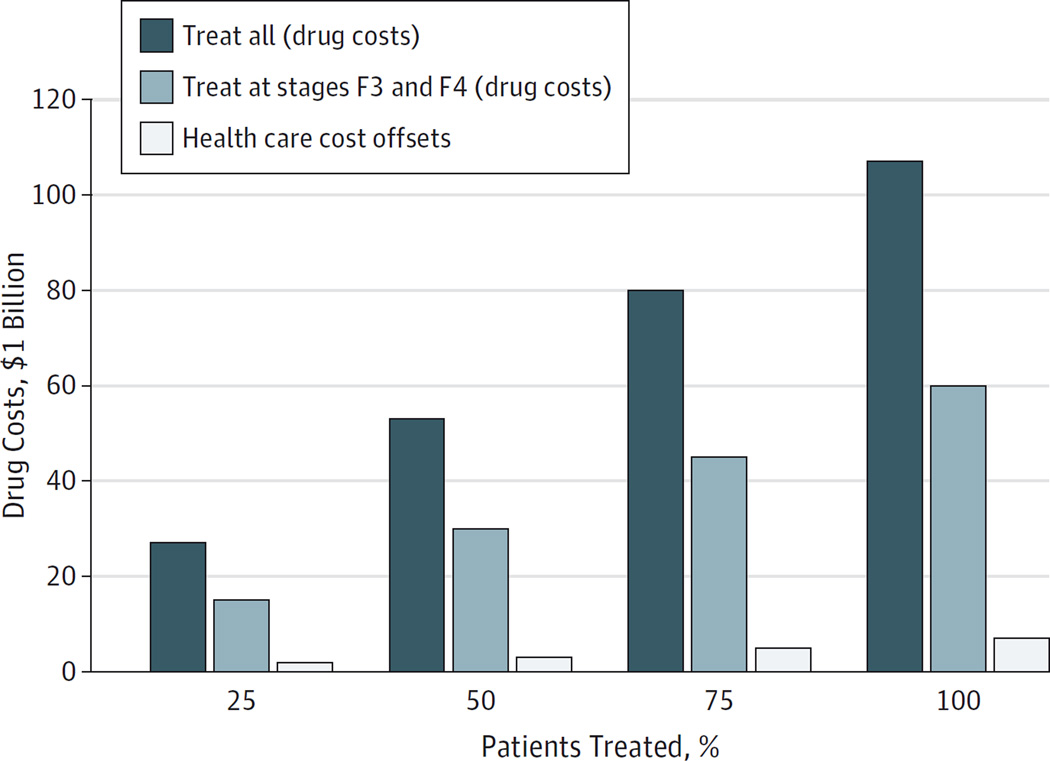
Figure 4. Budget Impact Analyses for Initial Treatment of Patients.
The figure shows total drug costs for treating 25%, 50%, 75%, and 100% of the 1.37 million treatment-naive patients (identified during the next 5 years) with combined sofosbuvir and ledipasvir for 8 or 12 weeks. The analyses are subcategorized by treating all patients (treatment regardless of fibrosis stage) and treating only patients who reached stages F3 and F4. Offsets in savings in lifetime health care costs (exclusive of drug costs) achieved by treating all patients vs treating those with stages F3 and F4 are also shown. Fibrosis is measured using the METAVIR stages (described in the Model Overview subsection of the Methods section).

