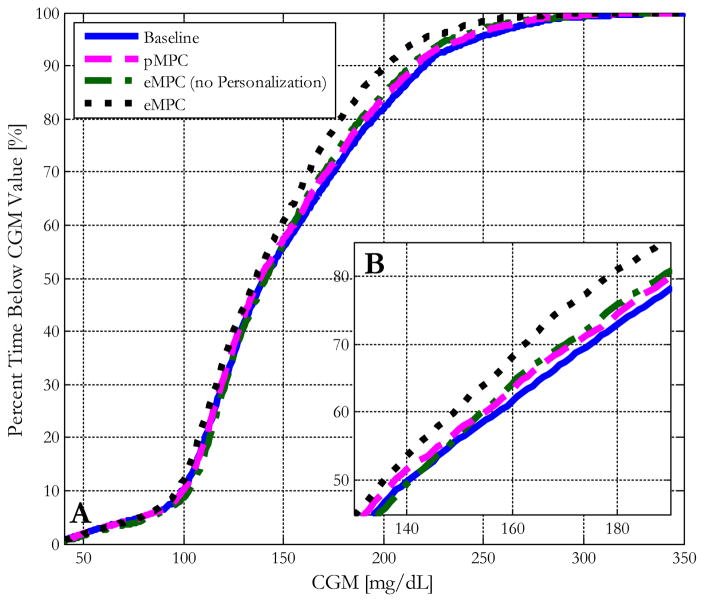
Figure 6.
(A) Blood glucose control performance characterized by the median cumulative distribution function plots of 10 in silico subjects within the UVA/Padova simulator controlled by the baseline MPC controller and the same controller enhanced with personalized gain, asymmetric cost function, and a combination of all advancements. (B) A zoomed-in view of the differences in % time below the value for the region from 140 to 180 mg/dL.

