
Figure 4.
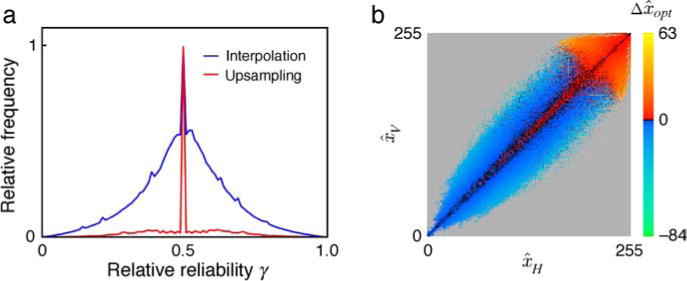
Reliability and recursive estimation. (a) Relative frequency of the relative reliability of the two estimates based on values in the horizontal and vertical directions for the task of estimating the missing or occluded image point (blue curve) and estimating a higher resolution image point (red curve). (b) Recursive estimation function for upsampling. The horizontal axis gives the optimal estimate of x given the observed values in the horizontal direction in the image, and the vertical axis gives the optimal estimate of x given the observed values in the vertical direction. The color scale gives the estimate of x given the estimates in the two directions minus the average of the two optimal estimates, for a relative reliability of 0.5. Gray indicates no data.