
Figure 5.
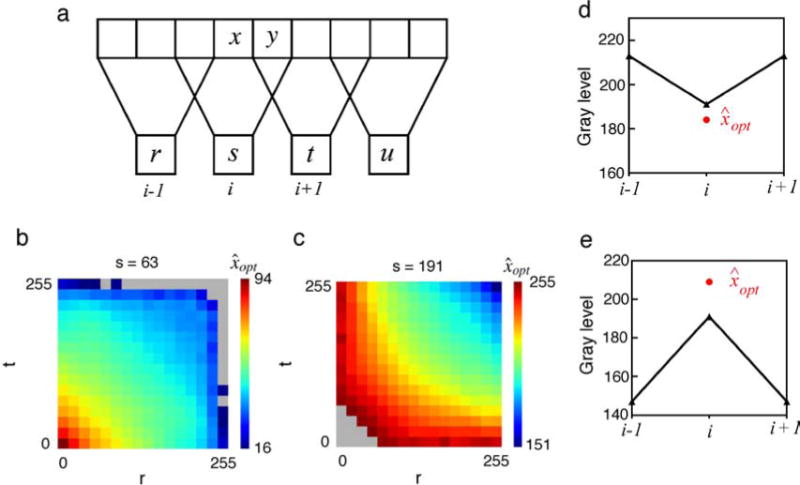
Estimation of a high-resolution image from a low-resolution image. (a) Fourth-order statistics are used to predict x from (r, s, t) and fifth-order statistics are used to predict y from (r, s, t, u). (b, c) Optimal estimation of x given (r, s, t) for two values of s. The color indicates the optimal estimate of x. Gray indicates no data. (d, e) Examples of specific point prediction for two bins in (c). The black triangles are specific values (r, s, t); the red circles are the optimal estimates.