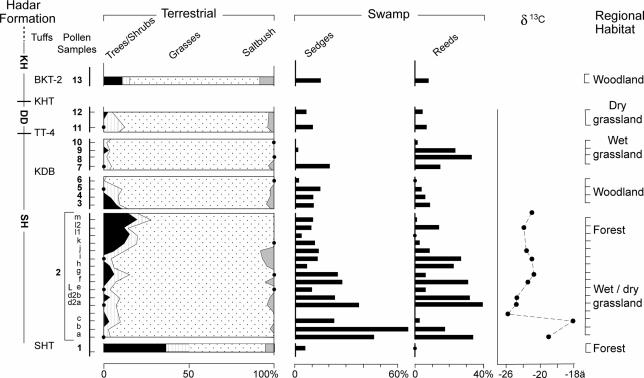
Fig. 2.
Summary pollen diagram of the Hadar Formation, showing pollen frequencies from trees/shrubs, grasses, and saltbush, calculated after excluding swamp component and fern spores. Stratigraphy as in Fig. 1. Interpretation of regional habitat is based on a classical palynological approach without statistical comparison. Stable δ13C values from total organic matter have been provided by T. E. Cerling (University of Utah, Salt Lake City).

