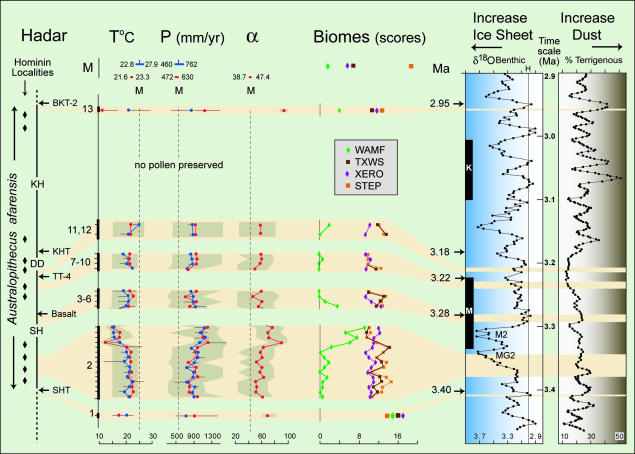
Fig. 3.
Estimated climatic parameters and biome scores associated with Hadar geochronology (Left) and related to variations of global climate (δ18O) and dust recorded from the Indian Ocean (Right). T°C refers to mean annual temperature (Tann) estimated by the BA method (blue curve) and MTCO estimated by the PFT method (red curve). P (mm/yr) refers to mean annual precipitation estimated by the BA method (blue curve) and by the PFT method (red curve). Humidity coefficient (α) is reconstructed by the PFT method. (Upper) Modern references (M) for Hadar correspond to the range of estimated climatic parameters and biome scores obtained on modern pollen samples, showing the overlap between the two methods. The vertical dotted line corresponds to the mean of the modern estimates, which is compared against Pliocene values. Red and blue dots represent the highest probability estimates; statistical error (see text) is indicated in gray for the red dots and by a horizontal solid line for the blue dots. Biomes (see text) include WAMF, STEP, TXWS, and XERO. Terrigenous percent is from Ocean Drilling Program (ODP) sites 721/722 (2). δ18O benthic is from ODP site 846 (29).

