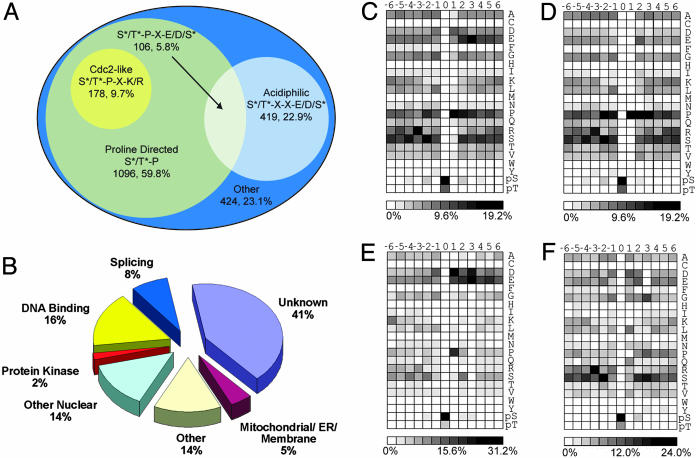
Fig. 3.
Classification of identified phosphorylation sites and amino acid frequencies surrounding phosphorylated Ser and Thr residues. From the 2,002 detected sites, 1,833 could be localized to a specific Ser or Thr without ambiguity. (A) Venn diagram representation of 1,833 precise sites of phosphorylation with respect to surrounding residues. Seventy-seven percent of the detected phosphorylation sites could be assigned as either Pro-directed or acidiphilic. (B) Phosphorylation sites grouped by protein localization and function. The largest class of proteins detected was “unknown” (uncharacterized or hypothetical). “Other” represents known proteins not in other categories (mostly well characterized cytosolic proteins). (C) Intensity map showing the relative occurrence of residues flanking all phosphorylation sites. (D) Intensity map showing the relative occurrence of residues flanking Pro-directed [(pSer/pThr)-Pro] phosphorylation sites. (E) Intensity map showing the relative occurrence of residues flanking acidiphilic [(pSer/pThr)-Xxx-Xxx-(Asp/Glu/pSer)] sites. (F) Intensity map showing the relative occurrence of residues flanking all other phosphorylation sites. To facilitate comparisons, an intensity gradient of light to dark was used ranging from white (no occurrence) to black (high occurrence).

