Fig. 3.
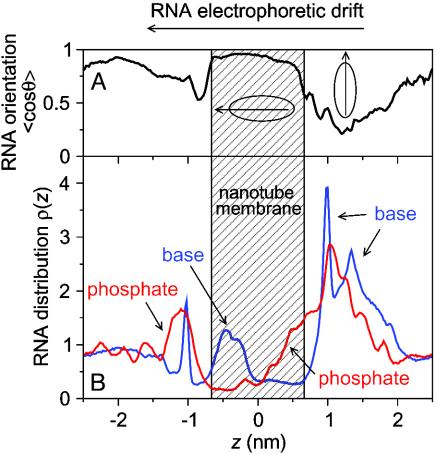
Orientational and density profiles of RNA. (A) Cosine of the angle θ between the long axis of A6 RNA, as determined from the inertia tensor, and the z axis as a function of RNA position, averaged over all simulations with applied electric fields. (B) Density profiles of bases (blue) and phosphates (red) of A6 RNA along the z direction.

